To Create a Custom Distribution Set
Custom distribution creation defines rainfall distribution (temporal pattern) for distribution based rainfall events. The rainfall distribution defines the shape, or pattern, of rainfall for a synthetic storm. When applying the rainfall distribution to a given storm duration and rainfall depth, it defines a specific distribution based rainfall event.
To create a Custom Distribution:
- In the Rainfall Manager > Distribution based rainfall > Custom distribution tab, click + Create custom distribution.
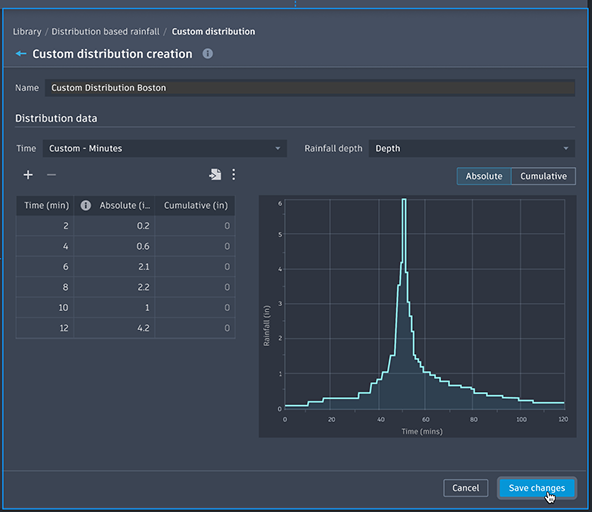
- In the Custom distribution creation dialog, input the Distribution data.
- Enter a table of data or load this from CSV using the settings above the table area to determine the fixed format.
- When finished, select Save changes to create the Custom distribution.
Distribution data
Time type
Time type sets the format to be entered or imported for the time data in the distribution. The time data can be entered as time values in minutes or as a percentage of the duration.
- Custom – Percentage: minimum two entries, must increase and end at 100%.
- Custom – Minute: minimum two entries, the overall duration of the curve will be used as the duration for any rainfall event using this distribution.
- Fixed - 1% Interval: prepopulates the table with 1% intervals up to 100%.
- Fixed - 2% Interval: prepopulates the table with 2% intervals up to 100%.
For Fixed 1% and Fixed 2%, no other entries can be added.
Rainfall Depth
Rainfall depth sets the format to be entered or imported for the depth in the distribution. The rainfall data can be entered as percentages of the total depth, or as the actual depth or intensity values.
- Percentage: must increase and end at 100%.
- Depth: input entries in mm or in, based on the drawing unit; values can increase or decrease, just like Known Rainfall.
- Intensity: input entries in mm/hr or in/hr, based on the drawing unit; values can increase or decrease, just like Known Rainfall.
Absolute / Cumulative toggle
This toggle selects the column that can be edited in the table, and also sets the column that will be displayed in the graph. It also specifies the format for the rainfall data when importing a file.
- Absolute: the amount of rainfall falling in that time interval.
- Cumulative: the cumulative represents the total of the rainfall accumulated up to, and including this time interval.
When an editable column is chosen, the other column is read-only.