
Viewing Luma Information with the 2D Luma Histogram
The 2D luma histogram shows the changes you make to luma content in a clip. Use the 2D luma histogram when you want to adjust the lightness of a sample. The 2D luma histogram is displayed in the Basics menu of the Colour Warper.
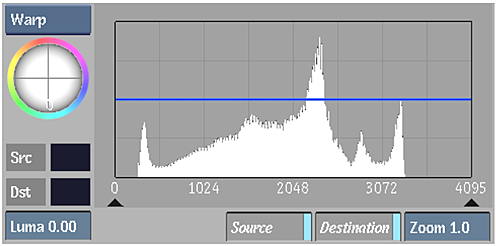
The 2D luma histogram can display:
- A histogram showing the distribution of image pixels across the luma range—the size and distribution of the vertical bars show the luma distribution.
- Source and destination colour values. Source colour values are the luma values in the front clip and destination colours are the luma values in the result clip.
- Plotted and reference colours that are obtained by sampling images in the image window. See Sampling Clips in the Image Window.
To view luma information in the 2D luma histogram:
In the Colour Warper menu, click Basics.
The 2D luma histogram appears in the Basics menu. R, G, and B values that are modified by the Midtones trackball are displayed as curves in the histogram.
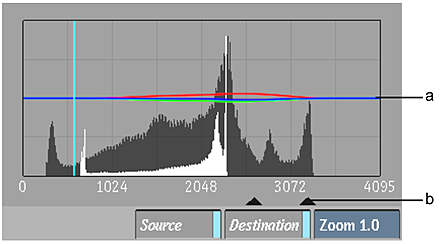
(a) RGB curves (b) Midtone triangle
Set the following options to show clip luma information.
Enable: To: Source Show a histogram of the luma values in the front, or source, clip. The source luma values are obtained from the current frame. Destination Show a histogram of the luma values in the result clip. The destination colour values are obtained from the current frame. When both Source and Destination are enabled, you see both the source and destination luma values in the histogram. Source clip colour values are displayed in black and result clip colour values are displayed in off-white.
Note: You can also toggle the Source and Destination buttons in the Setup menu to show or hide source and destination colours in the histograms.