Once you've run your deterioration model, you can view the results per group or per asset.
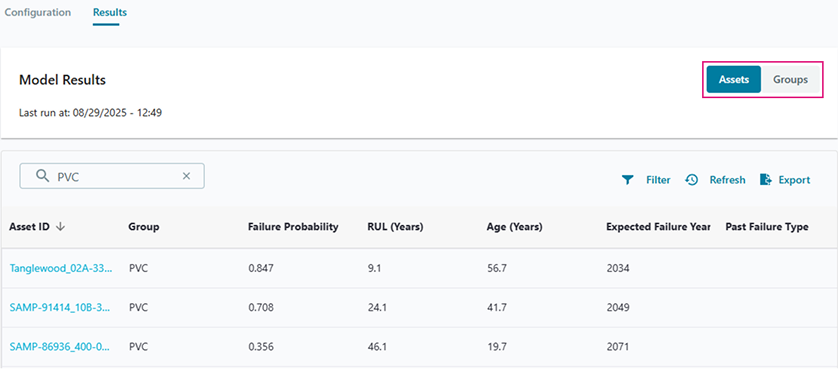
Per asset, you can see:
- Failure probability: Current failure probability for the asset.
- RUL (Remaining Useful Life): The asset has a 90% probability of failing in the specified number of years.
- Age: Current asset age.
- Expected Failure Year: The asset, at the specified year, has a 90% probability of failing.
- Past Failure Type: The earliest failure type that was detected for the asset when running the selected failure definition. This will be empty if you did not include a failure definition.
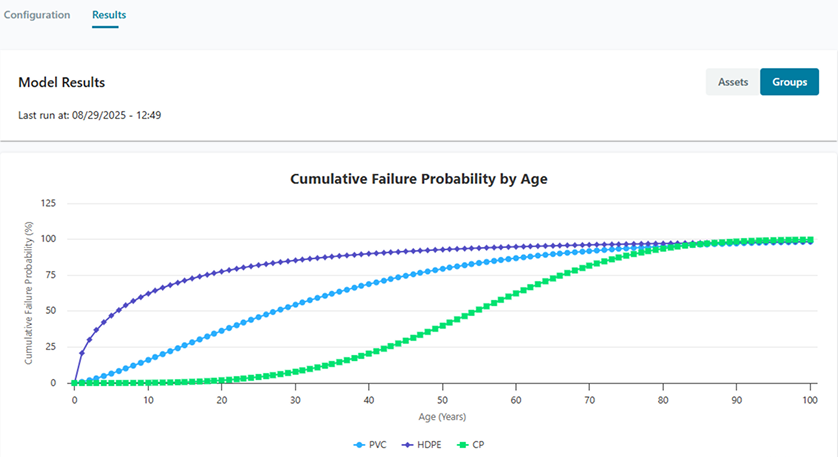
Per group, you can:
- Select one or more groups to see their cumulative failure probability curves/charts.
These curves are the inverse of the survival probability curves used in the configuration stage.
You can sort, filter, and export these results.