
When you create a deterioration model, Info360 Asset generates a survival curve to model the lifespan of each asset group based on the method and data you select.
Asset groups marked as "Undefined" don't have a survival curve method assigned. You can still run the model, but these groups will be excluded from it unless you select a method.

The method may be undefined if:
- You have not selected a failure definition for your model. In this case, you will need to select a survival curve method for all groups you want to include in the analysis. See below for how to do this in bulk.
- There are 5 or less failures for certain groups for the failure definition you selected. This is not enough data to generate a survival curve and you need to select a different method if you want to include these groups in your analysis.
To select a survival curve method:
- Locate the asset group you want to select a method for and click on Show Method.
- Or, if you want to use the same method (the exact same curve) for several groups, you can select the checkboxes beside them and then click on Actions

 Change Survival Curve Method.
- Select one of the available survival curve methods:
- Failure Definition: If you did not already add a failure definition for your model, you can still do this. See how in the section below.
For this method, a Weibull distribution is fit to the failure data provided. For the fit to be appropriate, at least 5 failures are required per asset group.
This method will not be selectable if you have not selected a failure definition for the model or if the group has 5 or less failures for the selected definition.
- Industry Standard Curve: These curves are pre-calculated Weibull distributions that are based on data from the PIPEiD congressional reports. The PIPEiD reports are based on extensive industry research and historical data for different pipe materials and diameters. Learn more about the available
industry standard curves.
To use these, you'll need to make sure your asset groups are set up based on material and diameter.
- Custom Curve: Create your own curve by adding specific survival probability and age pairs to define the points. A Weibull distribution will be fitted to these points.
Click on Add Another Point to start adding.
Tip: If you want to view an industry standard curve or a curve from another group on the chart as a reference while you create your own curve, select these methods first and then change the method back to Custom Curve.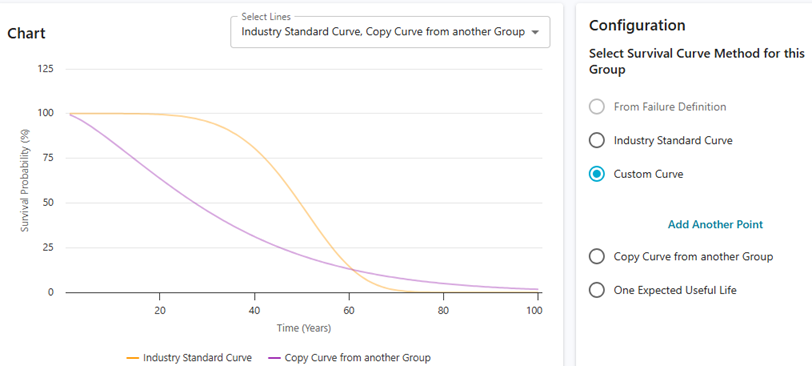
- Copy Curve from another Group: Select the group whose curve you want to use for this group.
Note: You cannot copy a curve from a group that has an undefined curve or that itself is copying from another group.
- One Expected Useful Life: Enter a single expected useful life in years (e.g., 70 years). This will be treated as a straight line that starts at age 0 with a survival probability of 1, and ends at age X (the expected useful life you specify) with a survival probability of 0.
- Failure Definition: If you did not already add a failure definition for your model, you can still do this. See how in the section below.
- Then click Select.
- Make sure to save any changes you make.
- When ready, you can run your model.
To add or edit a failure definition:
- In the Configuration section, click on Edit.
- Select a failure definition from the drop-down and then click Update.
- If you need to create a failure definition, see Create a Failure Definition.