Symptoms: One or more deployed data connector components (listed in Admin  Implementation) terminate mysteriously (status shows in red), without any useful information in the logs.
Root Cause: An external process, such as a security scanning tool, terminates Info360 Plant Data Connector components.
Solution:
Determine which processes are responsible for terminating the Data Connector components using a debugging tool called Global Flags.
Global Flags has a feature for monitoring processes and can send a message to the Event Manager indicating what was responsible for the termination signal.
To download, install, and run Global Flags:
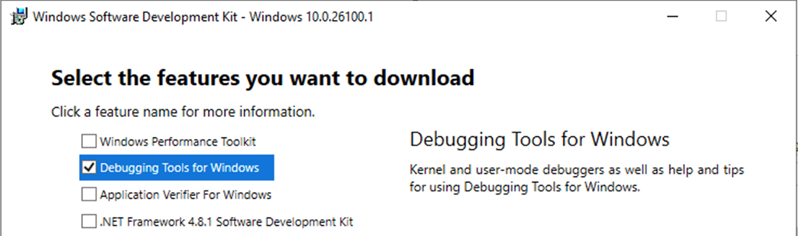
- Download the Windows SDK.
- When prompted, select 'Debugging Tools for Windows'. This is all you need to install.
- Once installed, open the Global Flags (X64) app (found in the Windows Kits folder).
Note: Do not use the X86 version.
- Go to the Silent Process Exit tab and enter the name of the application you wish to monitor in the Image field. See list of applications further below.
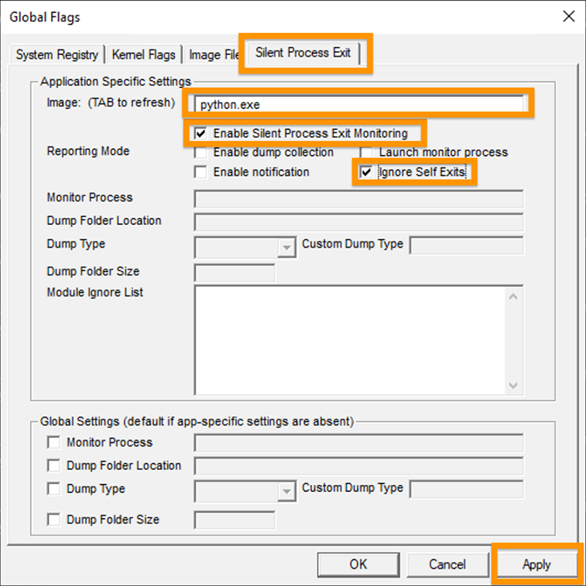
- Press the TAB key to refresh the page and enable some other options.
- Ensure the 'Enable Silent Process Exit Monitoring' and 'Ignore Self Exits' checkboxes are selected. Only select these options; other options may crash the tool.
- Select Apply.
Note:
- You may need to unselect the checkbox and select it again to enable the Apply button.
- When you select Apply, the Global Flags window should remain open. If it disappears, then it crashed and likely ignored your changes.
Repeat steps 4 to 7 above for each of the following applications:
- greengrass.exe
- python.exe
- node.exe
- java.exe
reg query "HKEY_LOCAL_MACHINE\SOFTWARE\Microsoft\Windows NT\CurrentVersion\SilentProcessExit" /s
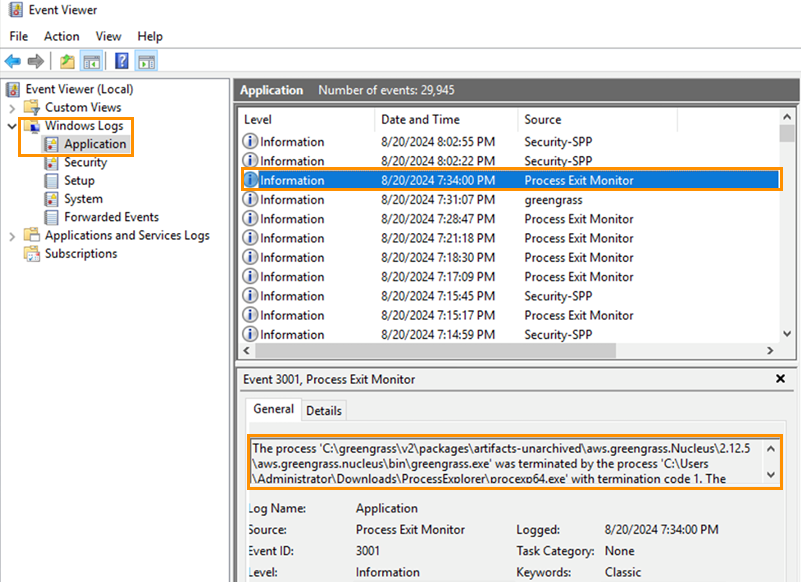
The next time any of the specified applications are terminated, a message will be sent to the Event Viewer. The event can be seen in Windows Logs Application, with the Source name 'Process Exit Monitor'. The event will indicate how it was terminated and by which process.