
The Profiler lets you measure where time is spent evaluating your scene. Use the Profiler (Window > General Editors > Profiler) to evaluate your scene for performance bottlenecks.
Profiler Dirty Events
Dirty Events should only be present in DG evaluation mode, and not in Serial or Parallel or GPU Override modes, as these modes have no overhead from Dirty events. If this category is empty, you have no dirty events.
Profiler Evaluation Events
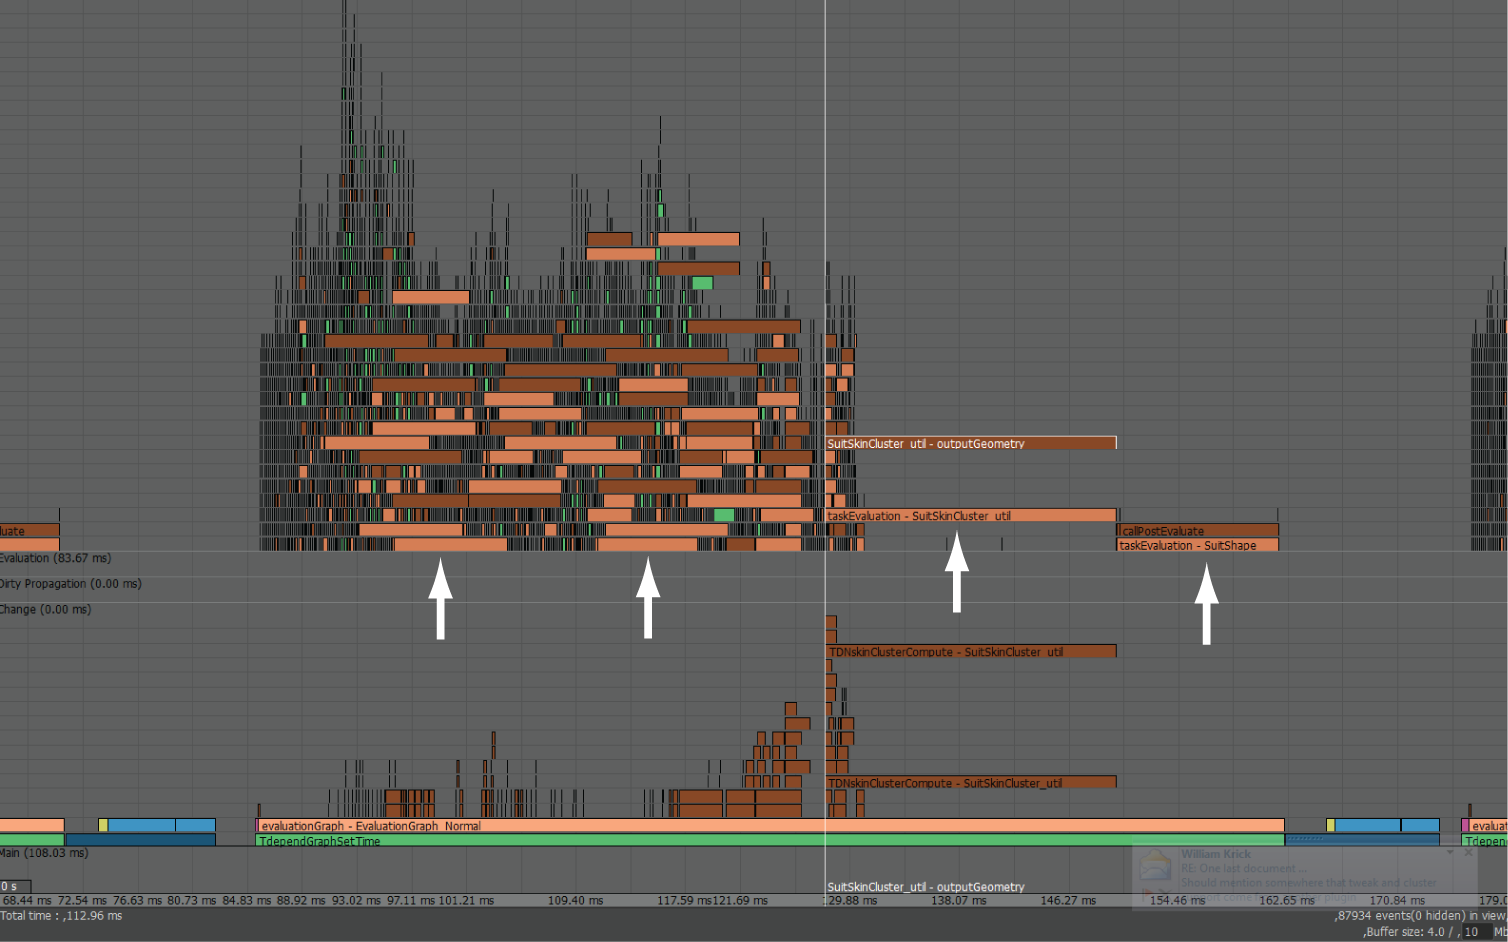
Evaluation events are shown in shades of brown in the Profiler. If bottlenecks are in evaluation, try to identify the rig elements that contribute to performance issues.
To locate an evaluation event:
- Click the bar that represents slow tasks in the Profiler. A label appears near the timeline cursor with the name of the node that is being evaluated.
- Next, open the
Node Editor and locate the node to investigate how it is being used in the scene. Determine if node settings are causing unnecessary computation, such as:
- Are there too many weights in your skinCluster? Can you reduce the amount?
- Are you using Blended weighting instead of Linear or DQ? Blended weighing is resource-heavy and requires more work.
- Are you using modeling nodes at rig evaluation time? (For example, deleteComponents is resource-heavy as it reevaluates every frame of the simulation.)
- Are you using the right deformer for the task? For example, if you have only 1 weight per vertex that never changes, you don't need a skinCluster deformer. If this is the case, use Cluster instead.
- Are you using costly deformers on elements of your rig that are not visible? (Evaluation events that correspond to deformations on the GPU appear in yellow.)
Profiler Rendering Events
On each frame, rendering is performed after evaluation events. Rendering events arise from drawing the scene geometry in the viewport. Rendering events are shown in blue. See Profiler colors for a list of what each event color signifies.