
To open the Evaluation Toolkit
Use the Evaluation Toolkit to analyze and understand how to best use Parallel evaluation modes to speed up your animation. Activate the options in the Evaluation Toolkit to manipulate all aspects of the Evaluation Manager, including enabling debugging modes and output. See also Test Performance with Evaluation Modes.
Configuration
Contains settings to let you configure the behavior of the tools provided by the Evaluation Toolkit.
- Graphviz Options
-
- Use Graphviz system installation
-
Activate this option to use your system's Graphviz installation instead of the one provided with Maya.Note: In order for Maya to locate find the Graphviz installation, ensure that the Graphviz folder that contains Graphviz executables is in the PATH environment variable. See Standard paths.
- Show Graphviz Version
-
Displays the output of the dot -v command, which reports the dot command software version.
1) Modes
Choose the appropriate evaluation mode from the Evaluation Mode menu
- Evaluation Mode menu
-
- DG
- Uses dependency graph-based evaluation mode for your scene. (See also Dependency graph.) This was the default evaluation mode before Maya 2016.
- Serial
- Uses the Evaluation Manager but limits evaluation to a single core (serial evaluation). Use
Serial to troubleshoot your scene as it prioritizes scene fidelity over performance so you can locate evaluation errors.
Note: Sometimes scenes run more slowly in Serial evaluation mode than in DG mode. This is because Serial evaluates more nodes than DG mode. Because of this detailed evaluation, if the scene looks incorrect in Serial mode, it is unlikely to work properly in Parallel mode.
Sometimes improper evaluation in Serial mode is caused by custom plug-ins.
- Serial (uncached)
- Like Serial (above) but uncached redetermines the evaluation order at every frame. Not recommended.
- Parallel
- Parallelizes evaluation and uses all available cores to evaluate your scene. If this mode causes problems with your scene, disable it and return to the previous standard: DG evaluation mode. This mode is active by default.
- GPU Override
- Works with the Evaluation Manager to accelerate deformations in either
Serial or
Parallel Evaluation mode. If your scene has standard
Maya deformers and the mesh geometry is dense, this can improve performance. Results vary based on the deformers and density of meshes in your scenes.
Note: GPU override works only with Viewport 2.0 and does not work with Quadro 4000 graphics cards on OSX.
- You can find a technical explanation of GPU Override at Using Parallel Maya.
- Include Controllers in Evaluation Graph
- Activates/disables pre-population with the controller mechanism in the Evaluation Manager when building.
- Advanced
-
Note: Unlike other Evaluation Toolkit settings, changes you make to the Advanced settings remain after Maya is restarted.
-
- Manipulation
- Toggles the Evaluation Manager for Manipulation. Valid only in Serial and Parallel modes.
- Reduce Graph Rebuild
- Toggles whether or not certain keying workflows (such as keying an unanimated attribute for the first time, adding a new different key to a static curve, or undoing those actions) invalidate the graph. Use this option to avoid graph rebuilds even when animating a previously static attribute.
- This option is on by default.
- Idle Action
- Lets you disable the automatic Cache Evaluation. The
Idle Action setting lets you set whether Cache evaluation occurs:
Setting Behavior Idle Rebuild and Prepare for Manip This setting is the recommended default. Off Nothing happens when Maya is idle. To trigger the graph rebuild and build the cache, you must perform an action, such as changing the time. Idle Rebuild Rebuilds the cache only when the graph is invalidated. Only rebuilds and prepares evaluation using the Evaluation Manager, but no partitioning or scheduling occurs. To trigger the partition and scheduling, you need to perform an action, such as chaning the time. Idle Prepare for Manip Rebuilds the cache only when the graph is built, or when graph partitioning is invalidated. The graph must be rebuilt manually. This action rebuilds the cache if caching is enabled.
2) Heads Up Display
You can display Evaluation and Frame Rate information in a view panel using the following Heads Up Display (HUD) options. For more Heads Up Display options, see Heads Up Display (HUD) Options and Display scene information (HUD) in a view panel.
- Cache
- Heads Up Display (HUD) output. This lets you monitor resource limits used for the caching process. Once the Cache setting is active in the Heads Up Display, proceed with Caching operations, using the Caching section below.
- Evaluation
-
Indicates the current Evaluation mode. See Evaluation in Preferences > Animation to change evaluation modes.
- If you are in DG mode, Evaluation: DG displays. The EM State status shows Off, and GPU Override status is N/A.
- If you are in Serial or Parallel mode, Evaluation: Serial or Evaluation: Parallel displays, along with the EM State.
- Frame Rate
-
Displays the frame rate in frames per second (FPS) for the current view in the bottom-right corner of the Viewport. The default is off.
The Frame Rate displayed is the refresh frame rate. The refresh frame rate represents the time between successive refreshes of the 3D viewport. The refresh frame rate updates if you are playing back or manipulating objects in Maya.
The playback frame rate is influenced by your Real-Time vs Play Every Frame settings. The graphics card vsync setting (which synchronizes the Viewport display with the monitor refresh rate and can be a reason why the frame rate may decrease if the number of Viewports increases).
3) Debugging
Use these options in this section to identify the problem areas of your scene.
- EM Validation
- Toggles the trace object that tracks invalid evaluation graph paths. It logs data accesses that do not respect dependencies represented by the evaluation graph. These unexpected accesses could lead to evaluation errors and instabilities, such as crashes.
- The output file contains missing dependencies detected during each playback frame. This only works in Serial mode.
- Trace results are saved in Maya’s Temp directory, in the _MayaEvaluationGraphValidation.txt file by default but you can specify another location. Find the temporary directory on your machine with the getenv("TEMP") MEL command.
- Computed Nodes Trace
- Performs a high-level trace of the compute path by toggling the trace object that prints out the nodes being computed. This only works in DG and Serial modes.
- Trace results are saved in Maya’s runtime directory in the file _Trace_Compute.txt. Find the runtime directory using the getenv ("MAYA_LOCATION") MEL command.
- Launch Profiler
- Opens the Profiler, a tool to help locate performance bottlenecks in your scene by recording and depicting the amount of time that each significant event, such as evaluation tasks, consumes.
- Launch Analytics window
- Opens the Analytics Objects Window, a tool to help analyze the contents of your scene or collection of scenes by running scripts on the scene(s) and reporting back what it finds. See Analytics Objects Window for descriptions of the tests you can run.
- Launch Scene Lint window
- Opens the Scene Lint window, a tool to optimize scene performance. Choose the process(es) to debug your scene (or choose Select All to run them all), and click Run Selected.
- After running the selected process(es), click
Apply All Selected Fixes to use the suggested improvements. Click
Clear Results to wipe the previous processes from memory.
Note: There is a difference between the Evaluation Manager reverting to Serial from being in Safe mode due to invalid node dependencies in the scene, and the Evaluation Manager reverting to Serial because it was set to Serial in the Preferences window. Check that the Evaluation is set to Parallel in the Animation (Settings) preferences window.
-
Option Description flat-animation Identifies flat animation curves which can be replaced by a single static value. opencl-no-gpu Identifies any mesh that potentially uses a slow OpenCL path. animated-expression Searches the scene for expression where the "animated" attribute value is set to 'true'. smooth-mesh Searches the scene for meshes with Smooth Mesh Preview enabled. floating-curves Deletes any floating curves from the scene. caching-status Provides information about possible Cached Playback issues. GPU-Deformation Provides information about GPU deformation issues. unused-expression-outputs Searches the scene for expressions that provide no input to anything. evaluation-manager-status Provides information about issues that may affect the Evaluation Manager. mesh-zero-vertices Provides information about issues that may affect the Evaluation Manager. NURBS-tessellation Ensures the efficient tessellation of NURBs. - Evaluation Graph Inspection
- This section provides a collection of tools that let you see how your evaluation graph and scheduling graph are constructed.
-
- Nodes to Inspect
- For each of the tools in the Evaluation Graph Inspection section you can choose to inspect either the entire graph, in which case you would choose All from the drop down menu, or only a subset, when you would choose Selected.
- When you choose Selected another field labeled Levels Deep appears. When displaying graph information you are usually interested in the connections between nodes. The Levels Deep value tells the tool how many steps away from the selected nodes to include in the output.
- In this context, "steps away" means "number of connections it has to traverse in the graph to go from one node to another". For example, if you have the graph connections A -> B -> C then node B is depth one from both A and C, and C is depth 2 from A.
- For clarity, the functions below will be described as if you chose the All option.
-
- Graphical Output
- Tools in this section will provide an output in either PDF or
DOT format for visualization of the evaluation or scheduling graphs. The visualization is similar to what you see in the node editor for the dependency graph.
Format Select the type of output you wish to produce. If PDF is set, then the graph is sent to a .pdf file. If DOT is set, then the graph is sent to a .dot file. In both cases, the tool attempts to open the file in your default application for the generated file so you can see it immediately. For example Adobe Acrobat for a .pdf file and graphviz for a .dot file. The Transitive Reduction checkbox is an option that tries to reduce the number of unnecessary connections in the graph being displayed. The resulting output is cleaner though it can take significantly longer to generate.
Output file This field shows where the file is created. By default, it is stored in your MAYA_LOCATION directory. Enter a new file name or browse to a new directory to change the location. The extension on the filename always reflects your currently selected Format (.pdf or .dot). Visual Graph When you invoke the Show button the visual representation of the Evaluation Graph will be generated in the format you have selected, and the result will open in your default application for that file type. The Add Dirty Plugs option includes a list of all plugs being set dirty in each node by the Evaluation Manager. Normally, you would not want this amount of detail, but it's useful for discovering missing attribute dependencies in the graph
Visualize Scheduling Graph When you invoke the Show button, the visual representation of the Scheduling Graph is generated in the format you have selected, and the result will open in your default application for that file type. The Scheduling Graph differs from the Evaluation Graph in that it groups sets of nodes together for evaluation as a group. For example, the invisibility evaluator clusters all of the invisible node together and evaluates them, by doing nothing, as one.
The Add Cluster Contents option lets you switch the cluster nodes from displaying a count of the nodes they contain to a list of all nodes by name. This is useful when you want to see which nodes a particular custom evaluator has clustered together.
- Text Output
- Tools in this section will provide an output in either JSON or plain text format for visualization of the evaluation or scheduling graphs.
Format Two types of output are available. The JSON format is more verbose; describing all node information and relationships in a key/value form. The Summary format compresses the information into a more compact display for quick reference Output Location You can choose to send the results to the Script Editor directly, or to an external File. The script editor is most useful when you want to quickly examine part of a scene; the external file is best for parsing and interpreting results offline. Output File This field is active only when you select the File option as the Output Location. It shows where the file will be created. By default, it will go into your MAYA_LOCATION directory. Enter a new file name or browse to a new directory to change that.. Evaluation Nodes Prints a list of evaluation nodes and connections on the selected nodes, or the entire scene, if nothing is selected. Activate Show Dirty Plugs to print a list of plugs that the Evaluation Manager sets to dirty before evaluation and computation.
Evaluation Nodes When you invoke the Show button, a list of all of the nodes in the Evaluation Graph is generated in the format you have selected. This usually means all of the nodes that are either animated or controllers. The Add Dirty Plugs option lets you include a list of all plugs being set dirty in each node by the Evaluation Manager.
Node Scheduling types When you invoke the Show button, the scheduling types for the nodes in the Evaluation Graph are displayed. The types are Parallel, Serial, Globally Serial, and Untrusted. See the Using Parallel Maya for more information. Scheduling Graph When you invoke the Show button, the contents of the Scheduling Graph are displayed in the selected format. The Scheduling Graph differs from the Evaluation Graph in that it groups sets of nodes together for evaluation as a group. For example, the invisibility evaluator will cluster all of the invisible node together and evaluate them, by doing nothing, as one.
Use the Add Cluster Contents option to include the set of nodes in all of the clusters being scheduled. This is useful for seeing which nodes a particular custom evaluator has clustered together.
- Scene simplification
- Retrieves the selected object's minimum dependencies.
-
- Select minimal scene
- Use this option identify everything required to evaluate the selected objects.
- Remove all except minimal scene
- Deletes every object that is not considered essential by the minimal scene selection option above.
Important: Data Loss! Do not accidentally save this version of the scene after activating this option.
- Dynamic Attributes
- Connected dynamic attributes sometimes create artificial dependencies that can prevent parallelism, which negate any performance gains from parallel evaluation. Use these tools to show connections between those types of dynamic attributes:
-
- Print extra connections
- Click Print to display a list of connections discovered between dynamic attributes. Results are displayed in the Script Editor.
- Remove extra connections
- Only use this option for debugging purposes, as it is meant to give an idea of potential performance gains that would occur when extra dependencies are removed. Use caution, as this option is an aggressive tool and could alter the evaluation output.
Important: Data Loss! Do not accidentally save this version of the scene after activating this option as data is lost.
- Scene simplification
- Retrieves the selected object's minimum dependencies.
-
- Select minimal scene
- Use this option identify everything required to evaluate the selected objects.
- Remove all except minimal scene
- Deletes all every object that is not considered essential by the minimal scene selection option above.
Important: Data Loss! Do not accidentally save this version of the scene after activating this option.
4) Custom Evaluators
Click the checkbox next to each Custom Evaluator to activate custom evaluation.
Use the
 (question mark) button to view supported configuration options for the associated custom evaluator. See the
-c / -configuration flag in the evaluator command reference.
(question mark) button to view supported configuration options for the associated custom evaluator. See the
-c / -configuration flag in the evaluator command reference.
Use the
 ("i") button to query information related to the associated custom evaluator.
Use the
 ("n") button to open a window where you can view the nodes claimed by the associated custom evaluator.
For background on the invisibility, frozen, dynamics and deformer evaluators, see Evaluator Reference. More technical detail is available in the Using Parallel Maya document.
| Custom evaluator | Purpose |
|---|---|
| invisibility | Removes invisible nodes (and any that drive them) from evaluation. For more details on the invisibility evaluator, see the
Evaluator Reference.
Note: The scene looks the same, regardless of whether the evaluator is enabled or not.
See the
Evaluator reference for more information about the
invisibility evaluator.
|
| frozen | Handles "freezing" workflows provided to control which part of the scene does or does not evaluate.
See the Evaluator reference for more information about the frozen evaluator. |
| curveManager | Adds additional nodes in the Evaluation Graph, which let you manipulate with Parallel evaluation and GPU deformation, resulting in improved responsiveness. It also requires fewer Evaluation Graph rebuilds since static nodes are already included in the Evaluation Graph. See the Evaluator reference for more information about the curveManager evaluator. |
| cache | Constitutes the foundation of Cached Playback. See Using Parallel Maya for more information. |
| timeEditorCurveEvaluator | Deals with custom curve evaluation requirements from the Time Editor |
| dynamics | Responsible for the correct evaluation of dynamics nodes that have unorthodox evaluation requirements.
See the Evaluator reference for more information about the dynamics evaluator. |
| ikSystem | Manages evaluation complications that arise from multi-handle IK systems. |
| disabling | Disables the Evaluation Manager (used for debugging purposes). |
| hik | Improves performance of HumanIK rigs. |
| reference | Improves performance of scenes with loaded/unloaded references. |
| deformer | Provides support for GPU execution of supported deformers. The
deformer evaluator implements the
GPU Override option
See the Evaluator reference for more information about the deformer evaluator. |
| cycle | Unrolls cycle clusters to augment the opportunity for parallelism and improve performance. Likely gives the best performance improvements when large cycle clusters are present in the scene. |
| transformFlattening | Improves performance of long transform hierarchies. |
| pruneRoots | Improves performance by scheduling together small individual tasks to reduce scheduling overhead |
5) Dynamics
- Mode
- Choose from five options:
Name Function Disabled Disables Parallel evaluation/Evaluation Manager as soon as there are active dynamics nodes in the scene. Legacy 2016 Reproduces the default settings of the 2016 release, by disabling evaluation as soon as unsupported nodes appear in the scene. The following node types are unsupported:
- nucleus
- pointEmitter
- rigidSolver
- rigidBody
- particle
- geoConnector
- field
- fluidShape
and any type derived from these.
Supported Implements complex evaluation for supported dynamics nodes and disables Parallel evaluation/Evaluation Manager as soon as there are unsupported nodes in the scene. The following node types are unsupported:
- rigidSolver
- rigidNode
- particle (unless also a nBase)
- fluidShape
- fluidEmitter
- dynHolder
- collisionModel
- dynController
- dynGlobals
- spring
- membrane
and any type derived from these.
Everything (NOT SUPPORTED) Uses all nodes, even problematic ones, as this mode does not use a blocked list. Custom (NOT SUPPORTED) This mode lets you try unsupported combinations of the options below…
- Advanced
-
- Disabling Nodes
- Disables the set of nodes that causes Parallel evaluation/Evaluation Manager.
- Handled Nodes
- The set of nodes read by the dynamics evaluator which that handles their evaluation.
- Action
- Select the action that the dynamics evaluator performs on the handled nodes.
Name Function None Ignores the nodes. Evaluate Implements evaluation whenever special evaluation requirements are required. Freeze Causes the Dynamics evaluator to freeze all of the nodes it processes in their current state. No evaluation is performed, the node is unaffected; this is the fastest method.
6) GPU Override
Displays the following reports in the Script Editor. See Evaluator Reference for a description of this evaluator and Using Parallel Maya for technical information about GPU Override.
- Active deformation chains
- Compiles a list of deformation chains (that is, a mesh and at least one deformer,) that are handled by the GPU evaluator.
- Mesh information
- Prints information about the current GPU deformation support for each mesh. If the mesh is currently handled by the GPU deformer, its deformation chain appears in the list. If the mesh is not handled by the GPU deformer, the list displays the reason for its exclusion.
- Selected nodes status
- Prints information about the current GPU deformation support for the selected nodes. If the node is currently handled by the GPU deformer, its deformation chain appears in the list. If the node is not handled by the GPU deformer, the list displays the reason for its exclusion.
- Clusters
- Prints a list of nodes for each cluster handled by deformer evaluator. Each deformer chain has its own cluster.
- Graphical Output
-
Expand the Graphical Output section of the GPU Override area to generate GPU deformer graphs that display information available with the deformerEvaluator -c command as a connected graph using Graphviz.
-
- Format
- Select a format for the output file: PDF, SVG, PNG, or DOT.
- Output File
- Enter a name for the Output file. Click the folder icon
 to browse to an output location.
- Include Plugs
-
Include plugs shows the full graph
- Disable this option if you do not want connections between nodes labelled with input and output plugs. This option is on by default.
- Selected Only
-
Selected only shows a condensed form of the graph
- Limits the graph to the selected nodes.
- Omit Passthroughs
-
Omit passthroughs shows and even more limited view of the graph
- Limits the graph to the selected nodes and leaves out any passthrough nodes.
- Visualize Deformation Graph
- Click the Show button to create the graph.
- Reuse
-
- Deformers
- Lets you control the reuse stage of the GPU buffer.
Option Behavior Never The nodes are never reused. Immediate This setting is the default. The nodes are reused if they still are valid after repartitioning. Always All nodes remain in memory during and after repartitioning for later reuse. - Sinks
-
Option Behavior Never The nodes are never reused. Immediate This setting is the default. The nodes are reused if they still are valid after repartitioning. Always All nodes remain in memory during and after repartitioning for later reuse.
- Debug
-
- Limit Minimum Geometry Size
- Disable this option to remove the Maya geometry vertex requirement, and allow all geometry go on the GPU. In Maya, a minimum number of vertices is set based on the detected graphics card. Use this option to temporarily override this limit for the duration of your Maya session.
- Allow Downloads
- Activate this option to enable GPU Downloads. This option is on by default.
- Allow Download Rejections
- Activate this option so that parts of the graph that need a GPU Download are rejected based on a review. This option is on by default.
- Outliner
-
The GPU
Outliner lets you keep track of nodes in the deformerEvaluator and the status of their blocking policies, if any.
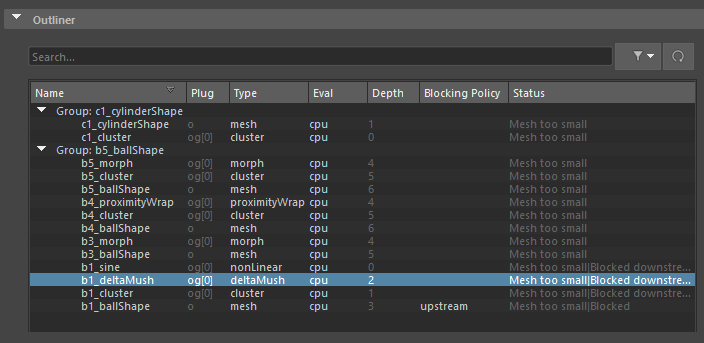
GPU Outliner
- The GPU
Outliner has the following functionality:
- Shows which nodes are in the evaluator and how they are grouped.
- Shows which nodes evaluate on the GPU, cause a download to CPU, and which evaluate on the CPU.
- Has a filter so you can limit the view of nodes that, for example:
- Match a wildcard name
- Belong only to meshes
- Evaluate only on the GPU
- Filter for passthrough nodes
- Display both upload/download status
- Have a blocking policy set
- Use the name of the target mesh for the group
- Update when you open, create new, reference, or import a file.
- Right-click the Outliner to open a contextual menu that lets you select nodes, visualize them as a graph, or set blocking policies.
-
Name Function Name Shows the name of the target mesh for all elements grouped under this node. Plug The node plug. Type The associated deformer. Eval Where the node evaluation is done; evaluate on the GPU, cause a download to CPU, and or evaluate on the CPU. Depth The order in the chain. Blocking policy If a Blocking Policy has been applied to the node. Status The current upload/download state of the Blocking Policy.
7) Selection
Select the following:
- Nodes under evaluation manager control
- Changes the selection to only nodes under the control of the Evaluation Manager. Nodes that are not directly or indirectly animated are not included in the set.
- Upstream nodes
- Selects all nodes that are currently under Evaluation Manager control that are upstream from the current selection. The nodes selected before the operation depend on which upstream nodes are selected after the operation.
- Downstream nodes
- Selects all nodes that are currently under Evaluation Manager control that are downstream from the current selection. The downstream nodes selected that are selected after the operation depend on which nodes are selected before the operation.
Upstream versus Downstream nodes
All nodes with connections in the Evaluation Graph are considered either Upstream or Downstream.
In the following diagram, you can see how Upstream and Downstream nodes interact.
- nurbsCone1_translateX => nurbsCone1
- nurbsCone1_translateX is upstream of nurbsCone1
- nurbsCone1_translateX is required by nurbsCone1
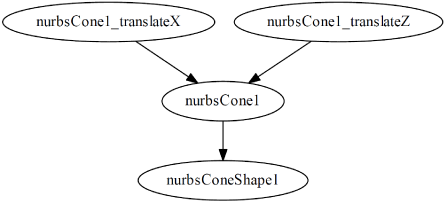
- nurbsCone1_translateZ => nurbsCone1
- nurbsCone1 is downstream of nurbsCone1_translateZ
- nurbsCone1 depends on nurbsCone1_translateZ
8) Cycles
cycles and their part in the evaluation process can be found in Using Parallel Maya.
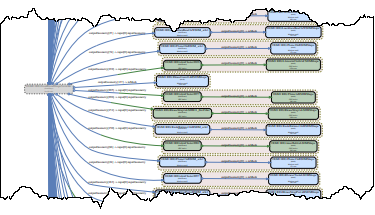
Full Graph
Creates .PDF and .DOT files to show the scene's current evaluation graph.
- Output Folder
- Type the path for the folder where the output graph is saved. Click
Generate to create the output graph. Click the folder icon
 to open a file browser where you can navigate to an appropriate folder.
- Output base file name
- Shows the file name for the base file. The default is _EvaluationGraph_.
- The generated files will add .DOT and .PDF to the chosen base file name.
- Generate
- Creates a Graphviz .DOT file with the current evaluation graph. If the Perform transitive reduction option is active, an extra .DOT (.tr.dot) is created that has the output of the transitive reduction (performed by Graphviz tred command). The .DOT file is then converted to a PDF file (using Graphviz dot command) and opened using the system's default PDF reader application.
- Perform transitive reduction
- Activate to perform Transitive reduction so that the output graph removes redundant dependencies to de-clutter the output graph.
Note: This process can be very long for large scenes.
- Mark clusters in full graph
- Activate this option to highlight evaluation clusters in the output graph.
- Open
- Opens the newly-created PDF file.
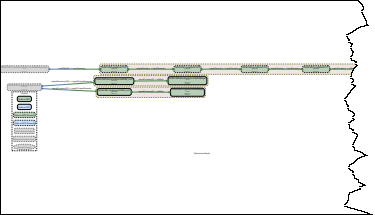
Cycle Graph
This section provides utilities for investigating cycle clusters in your scene. Cycle clusters are evaluated serially, therefore large cycle clusters can reduce the potential for parallelism and prevent efficient use of all CPU cores. Large cycle clusters limit general scene performance and breaking them up yields beneficial performance gains.
- Cycle clusters field
- Click Generate to display a list of cycle clusters in the current scene ordered by number of nodes in the cluster (largest first) in this field. Clusters that contain an amount of nodes below the chosen threshold will not be included in the list.
- For each cluster, the number of nodes and the first node of the cluster is printed. You can query the full cluster with the evaluationManager command.
- Cycle Size Threshold
- Define a minimum number of nodes of cycle clusters to be included. The default is 100.
Note: Small cycles are likely to be less relevant for performance analysis.
- Refresh Cycle cluster list

- Click to update the cycle list.
- Select the cycle based on selected nodes

- Choose the cycle that contains the selected nodes.
- List the nodes in selected cycle cluster

- Show all nodes in the cycle cluster.
- Shortest Path
-
When both a source node and destination node are specified in the currently selected cluster, both nodes are highlighted in green the output graph. The path from the source node to the destination node is blue, the path from the destination node to the source node is red.
Note: Deactivate Transitive reduction when using this setting as it can remove connections from those paths. - Shortest Path
-
- Source node
- Click Pick Selected to set the Source node.
- Destination node
- Click Pick Selected to set the Destination node.
- Shortest path only
- Activate this option to display only the nodes that are on the shortest paths.
- Output Folder
- Type the path for the folder where the cycle cluster graph is saved. Click
Generate to create the graph. Click the folder icon
to open a file browser where you can choose a destination folder.
- Output Base File Name
- Shows the file name for the base file. The default is _CycleCluster_.
- Perform transitive reduction
- Activate to perform Transitive reduction on the output graph to remove redundant dependencies to de-clutter the output graph.
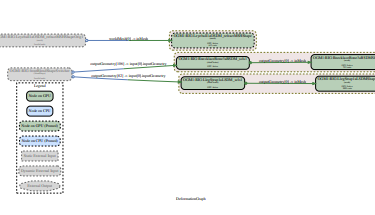
Dependencies
This section lets you generate a graph to show dependencies between two sets of nodes. This can be helpful to illustrate why two sets of nodes that should not depend on each other actually have dependencies on one another.
- Upstream/Downstream nodes
- Choose the nodes you want to use as the Upstream/Downstream node list and click Choose Selected to use this set of nodes.
- Output Folder/Output Base File Name
- Type the path for the folder where the graph is saved. Click
Generate to create the graph. Click the folder icon
to open a file browser where you can navigate to the appropriate folder.
- Perform transitive reduction
- Activate to perform Transitive reduction the output graph to remove redundant dependencies to de-clutter the output graph.
9) Validation
- Performance
- Runs emPerformanceTest on the current scene in DG, Serial, and Parallel mode. When you run these tests, results for each of the three modes (DG, Serial, and Parallel) are displayed. They also appear in the Script Editor. This test can be used to obtain benchmarks of your scene using different evaluation modes.
- EM Correctness
- Runs the emCorrectnessTest on the current scene. The Correctness Test runs the animation in Serial mode (without GPU Deformer Evaluation), and Parallel mode (with and without GPU Deformer Evaluation) and compares the evaluation output to validate correctness. When you run this test, results are displayed for each applicable mode. You can also view results in the Script Editor.
- Caching
- This area contains a list of Caching Correctness tests you can run on the current scene. Click Details to view the results in a new window (they are also displayed in the Script Editor).
Caching Correctness Tests
The Run VP2 Hdw, Run VP2 Sft, are Cache Correctness tests that play back the scene in Parallel Evaluation Mode (EMP) to get the evaluated values. Next, they enable caching, re-run the playback, and make sure the cached values match the EMP values.
| Term | Description |
|---|---|
| Run BG CI AA + | Checks background evaluation to make sure the evaluation context is maintained for animated attributes (AA).
(Animated attributes (AA) ensures that animated attributes (that is, the animated (not static) plugs on a node,) stay in the same context. |
| Run BG CI AN + | Checks background evaluation to make sure the evaluation context is maintained for animated nodes. Checks not only animated attributes, but any attributes on a node that is animated (that is, has at least one plug animated). |
| Run VP2 Hdw | Compares cached results against normal evaluation; Viewport 2 hardware caching mode. |
| Run BG CC | Compares background evaluation results against regular evaluation results. |
| Run DB All | Compares cached results against normal evaluation; datablock caching of all supported node types. |
| Run VP2 Sft | Compares cached results against normal evaluation; Viewport 2 software caching mode. |
| Run DB Shp | Compares cached results against normal evaluation; Databklock caching of only supported shape types. |
| Run BG CI SA | Checks background evaluation to make sure that evaluation context is maintained for both sides and animated data. This is a broad test, as it checks everything, even access to static nodes (that is, nodes without any animation). The broader the test, the more errors are reported. |
10) Reports
This section contains reports that you can generate for the scene. Currently, there is only one report about expressions. Results are displayed in the Script Editor.
- Expressions
- If active, reports the total number of expression nodes, along with the number of safe and unsafe expression nodes.
- Safe expressions are expressions which can have multiple outputs, as long as they are functions of its input.
- Safe expressions only output is a function of its input (the input being read through DG connections) and call no command other than mathematical functions. These nodes cannot have any side effects so they can be evaluated at the same time as other nodes. You cannot evaluate unsafe expressions in parallel with any other nodes. Unsafe expressions cannot be evaluated in parallel with any other nodes
- This report checks for the different types of expressions which might have a performance impact for your scene.
- Click Generate to create the report.
- Performance
- If active, runs the sceneLint() command and performs the checks in the SceneLint tool.
11) Freezing
These options let you activate or disable sections of the DAG (Directed acyclic graph) to improve performance. When Explicit Propagation is activated, everything that is set to frozen (either directly or indirectly) is not scheduled for evaluation, which improves playback performance. If you select Runtime Propagation instead, sections of the graph are still scheduled but are skipped at runtime.
Animated frozen states are still scheduled as they first must be evaluated to determine if they are required.
- Frozen Propagation
- Activate this option to set any reference nodes that are frozen to force nodes that they reference to also be frozen, regardless of any edits applied to them.
-
- Runtime
- This setting enables downstream pruning only at runtime. The frozen nodes are still scheduled, but once they are found to be frozen, all downstream evaluation is skipped.
- Explicit
- Activating this option is equivalent to enabling the frozen evaluator. It uses the freeze options to prevent any scheduling of nodes not evaluated by direct or indirect freezing. This setting provides the maximum playback acceleration.
- Downstream/Upstream freeze mode
- Lets you specify the strictness of the Freeze mode. Choose from Upstream or Downstream.
-
None No downstream/upstream propagation. When All Parents are Frozen The downstream/upstream node is frozen only when all of its upstream/downstream nodes are frozen. Always All downstream/upstream nodes from a frozen node are also frozen, even if they have other non-frozen inputs. - Freeze Invisible
- Propagates the frozen state down the DAG (Directed acyclic graph) hierarchy to all invisible children. This lets you freeze (make invisible) a root node and freeze its entire DAG hierarchy. Without this option, you need have to freeze each node individually. Chose from Nodes or Display Layers to make a node that is a member of an invisible frozen display layer frozen as well.
- Directly Frozen nodes
- Click Select to choose which nodes are frozen.
- Click Print to print a list of which nodes are frozen.
- Click Unfreeze All to deselect every node that has been frozen.
12) Scheduling
- Scheduling type override
- This option lets you choose a scheduling type override to apply to all nodes of a given types using the tools listed below. The following is a description of each override type:
Scheduling type override Description None No scheduling type override. This is the default setting. Parallel Asserts that the node and all third-party libraries used by the node are thread-safe. The scheduler evaluates instances of this node at the same time as instances of other nodes without restriction Serialize Asserts it is safe to run this node along with instances of other nodes. However, all nodes of this scheduling type are executed sequentially within the same evaluation chain. Globally serialize Asserts it is safe to run this node along with instances of other nodes but only a single instance of this node is run at a time. Use this setting if the node relies on a static state, which might lead to unpredictable results if multiple node instances were simultaneously evaluated. The same restrictions may apply if third-party libraries store states. Untrusted Asserts this node is not thread-safe and that no other nodes are evaluated while an instance of this node is evaluated. Untrusted nodes are deferred to the end of the evaluation schedule, and can introduce costly synchronization. - Registered Node Types
-
Select a Node Type from the Registered Node Types list and choose the scheduling type override you want to apply to specify when nodes are scheduled for Parallel evaluation by the scheduler. Click Refresh
 to update the
Node Types list.
to update the
Node Types list.
-
- Override for selected types(s)
-
- Click Print to display the currently activated scheduling overrides on node types selected in the Registered Node Types list.
- Set
- Click Set to assign the same scheduling type as set in the Scheduling type override options to all selected node types in the Registered Node Types list.
- Selected Nodes
- Select a node from the scene and choose the scheduling type override you want to apply to specify when nodes are scheduled for Parallel evaluation by the scheduler.
-
- Override for type(s) selected node(s)
-
Print Displays the currently activated scheduling overrides on the types of each selected nodes in the scene. Set Assigns the same scheduling type as set in the Scheduling type override option to the types of each selected nodes in the scene.
- Type used for selected node(s)
-
Print Displays the actual scheduling types used by the scheduler for each selected nodes in the scene, taking into account overrides or displaying the unmodified scheduling type if no override is present.
13) Caching
Caching lets you speed up the process of animating, by making Maya redraw only the parts of the animation that you have changed. Previously, Maya needed to recompute all the animation data every time it changed, no matter how small.
This section contains the settings for selecting a caching mode, as well as controls for invalidating and flushing your cache. For information on how to cache your animation, see Create an animation cache to increase playback speed.
- Cached Playback
- Turn on this option to cache animation to memory to improve playback speed. See Use Cached Playback to improve playback speed.
- % of RAM
- Move the slider to specify a cut-off point when the cache process will stop. Use this setting to specify how much memory (in percent) to dedicate for Cached Playback purposes (and not all of Maya).
Note: This setting affects Cached Playback only. However, increasing this setting may affect other processes running on the computer running at the same time. Also, running multiple Maya sessions using Cached Playback may also impact performance if too much memory is allotted.
- Stop caching at memory limit
- Activate this option to abandon the cache process when the designated memory limit is reached (this is the default setting).
- If Cached Playback is producing warnings about memory limits, you can disable this option to override the specified memory limit so that caching can continue. (Be aware that disabling this option may cause caching to use all your system’s available memory.)
- See the Memory Management area in the Evaluation Toolkit Caching section to view your system's memory status.
- Preferred Mode
- Choose a caching mode to determine what is cached. If errors occur, click Invalidate cache and Flush cache and try another mode.
- Hybrid Cache
-
This setting lets you extend Caching Playback to mixed with GPU deformation to improve caching with scenes that rely on heavy GPU computation and large rigs.Note: This mode also turns on the GPU Override setting. However, if you disable it, it does not turn off GPU Override.
Instead of caching full geometry after deformation, Hybrid Cache retains and restores the input to the GPU deformation chain. Typically this results in less data being stored, given that the input to the deformer chain (a few matrices, a few animated parameters, and so on,) is usually much smaller than the geometry being deformed. This also caches the original undeformed static geometry only once for the whole animation and leaves it on the GPU, resulting in smaller transfers between CPU and GPU memory.
The fact that geometry stays on the GPU can result in great performance gains, especially for large geometries, as well as significant memory usage reduction.
-
Setting Behavior Disabled Hybrid Cache is not used, geometries are cached normally. This setting is the default. Smooth Mesh Preview Hybrid Cache only applies to GPU-deformed evaluation clusters with at least one mesh using Smooth Mesh Preview. All Hybrid Cache applies to all GPU-deformed evaluation clusters. - Prevent frame skipping
- Activate this option when you are playing back in real-time (see Playback in the Time Slider preferences) to ensure that Maya does not skip frames while it builds the Playback Cache.
- Normally, when you play back animation in Real-time playback speed, Maya skips frames to maintain the rate. But if you intend to create a playback cache, you do not want any frames to be omitted.
Note: Once the Playback Cache is complete and the Time Slider is filled, frame skipping is active again if cached playback still cannot achieve the requested frame rate.
- Show warning messages
- Activate this option to display support messages in the script editor whenever an event occurs that disables or causes problems with caching. See Cached Playback Limitations and Cached Playback unsupported nodes for more information on conditions that can disable Cached Playback.
- Discard frames outside playback range
-
Activate this option to flush any cached data from frames that fall outside of the current playback range. This means that if you resize your playback range so that some cached frames no longer fall within the active caching area, their caching data is lost.
- Cache smooth meshes
- Activate to include Smooth Mesh Preview in the Caching process.
- Smooth Mesh Preview is not cached by default as it slows down Cached Playback significantly due to the amount of memory used by subdivided meshes.
- Cache dynamics
- Use this option to turn off dynamic object caching. (This setting is active by default)
- Caching with dynamics nodes splits caching into separate animation and dynamics status lines on the Time Slider, represented by blue (animation) and pink (dynamics) lines.

The Animation Cache and Dynamics Caches shown as two different status lines.
- Cache fill
- The Cache fill menu section lets you control how the cache gets filled.
-
Order Description Command Playback Cache is filled only with playback (foreground). This setting is useful for debugging or scenes with background correctness issues. syncOnly Background Cache is filled only in the background. Caution: This is the future default for scenes containing dynamics. This setting is still being tested.asyncOnly Playback & Background The default setting. The cache fills both during playback and from background tasks. syncAsync Note:You can view the Cache fill status in the Heads Up Display (HUD). When the Cache fill menu is set to:
- Playback, the cache HUD shows "On (sync)".
- Background, the cache HUD shows "On (async)".
- Playback & Background, the cache HUD shows "On (sync+async)".
- Background fill direction
- This menu lets you set the direction (or order) that Maya fills the cache in the background.
Order Description Forward & Backward Builds the cache by reading the animation both ways. This setting is the default and is best for scrubbing. 
Forward Builds the cache by reading the animation from a position onward. This setting is good for playback. 
Backward Builds the cache by reading the animation from a position backward to the change. 
Forward from Animation Start Builds the cache from the beginning of the animation. Use this setting if you are using plug-ins. 
- Apply custom modes
- Cached Playback has several modes designed to optimize the caching process for your system, documented in
Choose a caching mode. The following custom caching modes are included for debugging purposes:
Mode Description Reapply Preferred Mode These unsupported/debug modes do not persist in the preferences after you applying. One finishing testing with these modes, use this setting to reapply your preferred supported modes. Shapes, evaluation cache Takes the scene's transform, and geometry data (such as transforms, meshes, NURBS (curves and surface), subdivs, Bezier curves, lattice and baseLattice shapes, lights, cameras, and image planes) information, as well as their immediate parent transforms. Viewport Software cache (without fallback) Takes the scene's transform, and geometry data (such as transforms, meshes, NURBS (curves and surface), subdivs, Bezier curves, lattice and baseLattice shapes, lights, cameras, and image planes), and stores it in a format that the renderer can read. VP2 software cache uses this format after this translation, and so is closer to rendered result. Unlike Evaluation cache, it avoids the translation step that occurs when restoring from the cache and therefore faster. It stores the data in main memory, which maybe desirable or not. It still needs to send the data to the GPU after restoring from the cache.
Note: This caching mode works only in the Viewport 2.0 viewport. Other viewports will not update correctly. For information on changing the Viewport, see Viewport 2.0 in Display preferences.VP2 Software Cache Data is stored in main memory, or RAM.
Viewport Hardware cache (without fallback) Similar to Viewport 2 Software cache mode, above, except buffers are stored as hardware buffers on the GPU, or VRAM (instead of the CPU). The VP2 hardware cache stores the data directly on the GPU, which is faster except GPU memory is often limited, so it must be used with care. Custom Caching (NOT SUPPORTED) This option is not supported. This is the Mode that Maya defaults to if it reaches a caching point state that is not one of the supported modes. Because Maya bases the caching mode displayed in the Mode menu on the currently active caching points, if the caching points have been manually changed, the scene may reach a state that doesn’t match any of the Cache Modes offered. Note: Fallback is a mechanism that recognizes situations where it might be unsafe to use VP2 caching on some nodes, for example, the way the node is used, what is animated, and so on. This mechanism "falls back" to using Evaluation Cache mode in these situation. Some debugging modes do not use this fallback mechanism. You can use it for debugging or analyze potential performance gains. - Flush cache synchronously
-
Normally, when you flush the cache, Maya momentarily freezes the user interface to free up the resources needed build the cache in the background. Activate this option if you want to keep control of Maya (that is, no freezing,) even if the cache is not fully flushed. When active, this option flushes the cache asynchronously, that is, in the background.
Note: This option refers to flushing the cache. It does not involve cache rebuilding.This setting is useful if you want to ensure that the memory is fully released to do the job. Also, you can use this setting while performing automated tests or benchmarking, to ensure that you are measuring the right thing(s).
-
- Invalidate cache
- Used for debugging purposes, this option disconnects the current caching data from items selected in the scene. Clicking
Invalidate cache only disconnects the cache data for the selected scene elements (or everything in the scene, if nothing is selected).
Note: To simply empty the cache data from memory, use Flush Cache, below.
- Use this option to identify problematic controllers to see what happens when you manipulate only the selected controllers. The disconnected cache data from the scene is retained, but because some of the cached data has been disconnected from the cache, Maya is forced to re-cache the missing parts of the scene.
- The cache is outdated (or rendered 'invalid',) anytime something changes in the animation data. For example, if you added a key to curve, the value of that curve changes for a few frames. These changes, however small, trigger the invalidation of those frames, the curve, and everything depending on it.
-
Note: Unlike flushing the cache, invalidating the cache only marks the data as invalid, causing the missing data to be re-evaluated. Invalidating the cache is faster than flushing it, because the re-caching happens right away as opposed to at the next evaluation.
- Flush cache
- Clears all stored cache data.
- Primarily used for debugging purposes, flushing empties the whole cache and permanently discards any content so that cache file must be rebuilt.
Note: Because the flushing the cache clears any existing caching data, it may take a few minutes, depending on the size of what is stored.
- Trigger rebuild
- Restarts background evaluation to compute invalid or missing cache data.
Note: Click Flush cache before Rebuild cache to force recomputation of all cache data.
- Dynamics
-
- Refresh simulation on cache update
- Turns on caching for dynamics and simulation nodes. Shows Dynamics updates ‘live’ in the Viewport when the cache catches up to that current frame. When off, you have to refresh the frame manually by changing the time to see the updated result of the simulation (given the frame is already cached in the background).
- Memory Management
- This area lets you allocate how much memory is devoted to caching your scene. This area also displays the current memory statistics to let you monitor your usage.
-
- Update memory
- Displays the amount of memory that used, the amount of physical memory on your system, and the amount of virtual memory Maya has allocated.
- Safe mode messages
- Prints information on what is causing the caching process to stop.
14) Invisibility
The Invisibility evaluator lets you manage visibility changes. Use Scheduling mode to manage visibility changes without the need to repartition.
- Mode
- There are two modes:
Mode Function Partitioning Invisibility optimizations are handled at partitioning time, therefore visibility changes trigger repartitioning. Scheduling Invisibility optimizations are handled at scheduling time, therefore visibility changes do not trigger repartitioning. - Invalidate Visibility Information
- Click Invalidate to invalidate any visibility information, forcing the Invisibility Evaluator to recompute it.
- Advanced
-
- Notification
- Choose what viewport notifications are displayed when nodes become visible:
Notification Type Function None No notifications. Visibility Visibility status notifications only. Transform + Geometry Transform, geometry, and visibility status.