
Quickstart Fill tutorial: Review results
In this step, you review the Fill Time, the Pressure at V/P switchover, and the Temperature at flow front results.
Open the model from your previous analysis.
Fill Time result
Click Fill time from the Results in the Study Tasks list.
Rotate, Pan, and Zoom the model as necessary to inspect the Fill time result.
Click
 (Results tab > Animation panel > Play) to animate the result. Use the other animation tools to understand their function.
Rotate the part similar to the plot.
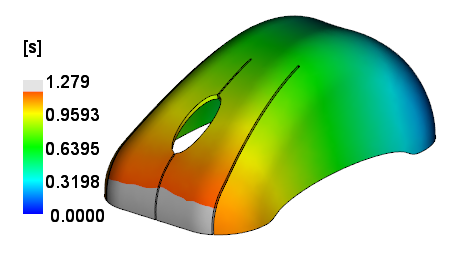
The image shows that the outer corners have filled before the inner two tabs.
Click
 (Results tab > Examine panel > Examine) to show the value at a specific location on the part. Use the CTRL key when clicking the part to select more than one location.
Pressure at V/P Switchover result
Click Pressure at V/P switchover in the Study Tasks list.
Rotate, Pan, and Zoom the model as necessary to inspect the result.
Click
(Results tab > Animation panel > Play) to animate the result.Rotate the part similar to the plot.
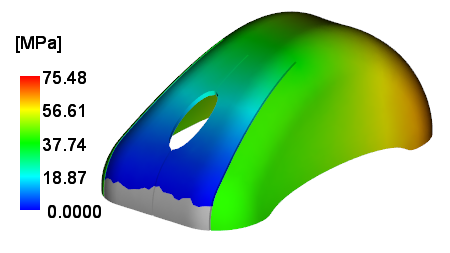
There is a significant pressure difference at V/P switchover between the areas of concern. The inner tabs are blue so they have a pressure of zero, and the corners by the tabs are green and have a pressure of about 40 MPa. This shows an imbalance in pressure and filling and can be a cause of warpage.
Temperature at Flow Front result
Click Temperature at flow front in the Study Tasks list.
Rotate, Pan, and Zoom the model as necessary to inspect the result.
Rotate the part similar to the plot.
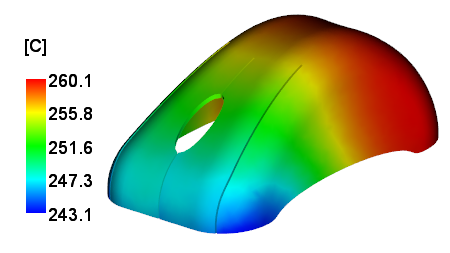
The outer corners are cooler than the inner tabs by about 3C. This difference is caused in part by the unbalanced filling but the difference is not significant.