Analyze Buffers During Simulations
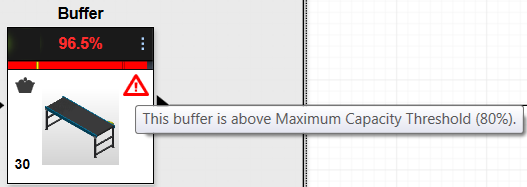
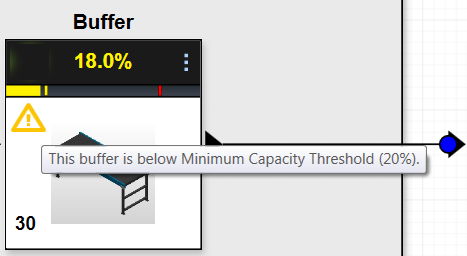
Buffer capacity utilization is displayed at the top of the node.
Hover over the status bar to reveal current measurements:
- Maximum Time in Buffer: the longest time an item stayed in the buffer
- Average Time in Buffer: the average time items stayed in the buffer
- Rate of Fill: (new percentage full - old percentage full)/(time of the new change in buffer - time of the last change in buffer)
- Product(s) Quantity: the number of items in the buffer
A yellow alarm appears if buffer utilization falls below the minimum capacity threshold you set in the Buffer Settings window.
A red alarm appears if buffer utilization exceeds the maximum capacity threshold you set in the Buffer Settings window.