
Maps on Solids presents maps or isolines of displacements, stresses and strains obtained during analysis of a volumetric structure. Results can be presented in the form of a map, isoline, isosurface or a map on a cut through a solid. Results are presented on the external face (contour) of a solid, on a cut surface or for selected elements.
The dialog consists of four tabs.
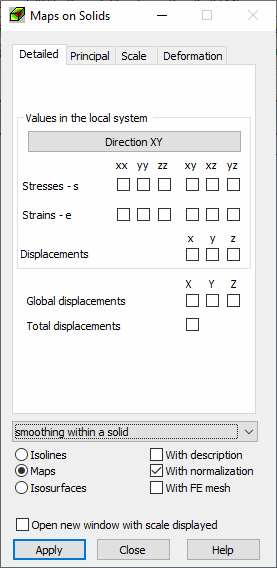
Results for volumetric elements (solids) are presented in tabular or graphical form, including the following.
- Stresses
- In the user defined local coordinate system (globally for the entire model).
- In principal directions, if a stress tensor assumes the diagonal mode.
- As reduced values according to a selected hypothesis.
- Strains
- In the user defined local coordinate system (globally for the entire model).
- In principal directions, if a stress tensor assumes the diagonal mode.
- As reduced values according to a selected hypothesis.
- Displacements
- Available in the user defined local coordinate system (globally for the entire model).
- In the global coordinate system as total displacements (length of a displacement vector).
The lower dialog allows selection of a graphical form for result presentation of volumetric finite elements.
- Isolines. Isolines on a solid external contour.
- Maps. Maps on a solid external contour.
- Isosurfaces. As surfaces (of the same values) inside a solid. The number of surfaces is determined by the number of scale colors. The duration of isosurface generation increases with large quantities of colors.
Both maps and isolines may be presented as averaged values between elements.
Smoothing (Averaging of values)
Results for planar FEs are determined at Gauss's points located inside each element. Results estimated at the common node of adjoining elements may differ slightly in each element, and isolines may not be continuous. To obtain a smooth map of a selected quantity, select the with smoothing option. This results in averaging of the values at a node based on all the values obtained in the elements adjoining the node.
Smoothing may be performed by selecting one of the following.
- No smoothing
- Global smoothing
- Smoothing within a solid
- Smoothing according to selection
- Smoothing according to properties.
The lower dialog also contains the following options.
- With Description. Selects isoline descriptions or displays values in element center. For isosurfaces this should be a single value for a given isosurface.
- With Normalization. Selects automatic calculation of extreme values for a scale.
- With FE mesh. Apart from a map of a selected quantity, element meshes of generated finite elements are presented.
- Open new window with scale displayed. Opens a new window which displays only selected elements and objects. The window is divided into a view and a scale legend. For isosurfaces a scale should be displayed in the same form as isolines (narrow lines on the scale).
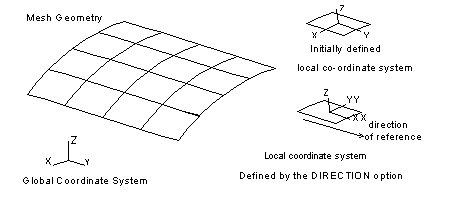
The X and Y axes are local and defined using the Direction option on the Detailed tab. You can define the main direction of the local coordinate system which will be used (x axis). The result values for all elements are calculated to this rotated coordinate system. The direction may be defined by entering any vector defining the main direction when selecting the results for surface FE. The selected vector is then projected onto an element which in the end defines the positioning of the local x-axis. The main vector can not be perpendicular to the element (parallel to the local element z axis). If this direction is selected, all results will be equal to zero.
Typically all elements are located on a cylindrical surface. Initially local x axes are parallel to the global X axis. These axes will be redefined when using the 'main' direction (reference direction) which is parallel to the global Y axis.
See also: