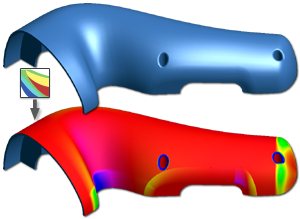
In the part and construction environments, use the surface analysis commands to analyze a part to validate the geometric quality before manufacturing. You can save several different analyses of the same or different types for a specific model. For example, you can define several ways to analyze a particular set of surfaces on the same model.
Once an analysis is applied, an Analysis folder is created in the browser and the analysis is placed in the folder. Each saved analysis is added to the browser in the order it is created. In the browser, the name and visibility of the active analysis is displayed along with the analysis folder name. For example, Analysis: Zebra1 (On).
You can change the visibility of the active analysis and create new analyses. When visibility is turned off for an active analysis, the check box is dimmed and the analysis name beside the Analysis folder changes to (Off). The analysis graphics in the graphics window are no longer visible. Expand the Analysis folder to view and manage all other saved analyses. You can switch the active analysis or edit, copy, and delete any saved analysis in the list.
Zebra analysis
Analyzes surface continuity by projecting parallel lines onto the model. Results show how light reflects off the surface to help you identify areas where the surface quality must be improved. Curvature is a mathematical indication of the smoothness between two curves or surfaces. The rate of change of direction is called curvature. The smoothness of a curve is usually specified by the letter G followed by a number.G0 (point) continuity means the endpoints touch. The transition between the two edges or surfaces is noticeable. It can be a sharp or gradual transition. The following image shows a zebra analysis of a G0 intersection between two faces. The faces meet, but the stripes do not line up.
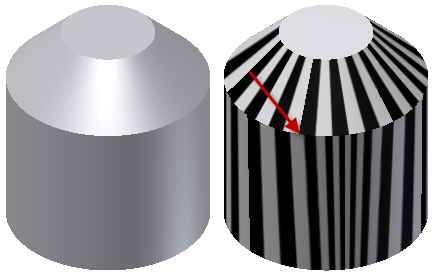
G1 (tangent) continuity is a smooth transition between curves. The two curves or surfaces appear to be traveling in the same direction at the join, but the rate of curvature change (speed) is noticeable. The following image shows a zebra analysis of a G1 intersection between two faces. A tangent fillet exists between the two faces. The stripe edges line up, but contain a sharp angle.
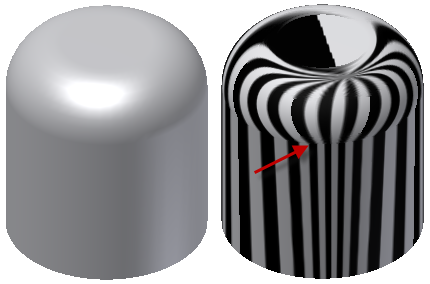
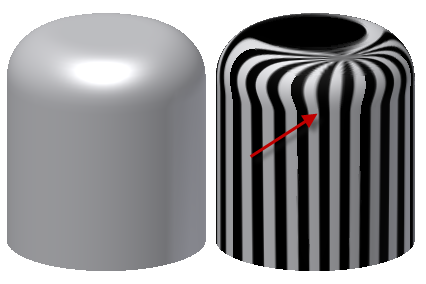
G2 (curvature) continuity is a very smooth transition between curves. The two curves match at the endpoints, are tangent, and have the same "speed" (curvature) at the join. The following image shows a zebra analysis of a G2 intersection between two faces. A Smooth (G2) fillet exists between the two faces. The stripe edges line up and have a smooth transition between the faces.
Draft analysis
Evaluates if a model has adequate draft between a part and mold (based on the pull direction) and can be manufactured by casting. A spectrum shows draft angle changes within a specified range.
Curvature comb analysis
Provides a visual analysis of the curvature and overall smoothness of model faces, surfaces, sketch curves, and edges. In the Construction environment, analysis of groups and imported wires are also included. The curvature comb plot shows curvature with a series of connected spines radiating outward from the curve. The relative length of the curve is equal to the curvature of the curve at the point where the spine originates. Longer spines indicate areas of higher curvature, and shorter spines indicate lower curvature.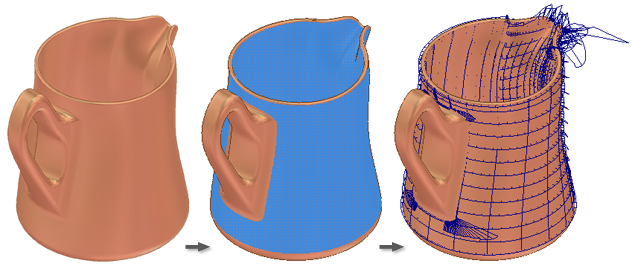
Select different geometry to reapply the analysis style without modifying the style definition.
Gaussian curvature analysis
Gaussian curvature analysis - Evaluates areas of high and low surface curvature using a color gradient display on part surfaces. The gradient display is a visual indication of surface curvature that uses the Gaussian curvature , Min Curvature, or Mean Curvature analysis calculation.Gaussian: Displays a gradient representing the product of curvature; curvature in the u direction of the surface multiplied by curvature in the v direction of the surface. Gaussian analysis is useful for inspecting such shapes as a coil, torus, or a sweep along a spline path.
Mean Curvature: Displays a gradient representing the mean curvature of the u and v surface curvature values. Mean curvature analysis is useful for inspecting such shapes as a cone or many of the surfaces which can be generated using the loft feature.
Max Curvature: Displays a gradient representing the greater of u or v surface curvature values. Max curvature analysis is useful for locating areas of high or low curvature in a part or surface.
Curvature Calculation
At any point on a curve in the plane, the line that best approximates the curve passing through this point is the tangent line. Alternatively you can also find the best approximating circle that passes through this point and is tangent to the curve. The reciprocal of the radius of this circle is the curvature of the curve at this point.
The best approximating circle can lie either to the left of the curve, or to the right of the curve. If this is key, then a convention is established, such as giving the curvature positive sign if the circle lies to the left and negative sign if the circle lies to the right of the curve. This is known as signed curvature.
Normal section curvature is one generalization of curvature to surfaces. Given a point on the surface and a direction lying in the tangent plane of the surface at that point, the normal section curvature is computed by intersecting:
- the surface with the plane spanned by the point
- the normal to the surface at that point
- the direction.
The normal section curvature is the signed curvature of this curve at the point of interest.
The principal curvatures of a surface at a point are the minimum and maximum of the normal curvatures at that point. (Normal curvatures are the curvatures of curves on the surface that are lying in planes including the tangent vector at the given point.) The principal curvatures are used to compute the Gaussian and Mean curvatures of the surface.
The Gaussian curvature of a surface at a point is the product of the principal curvatures at that point. The tangent plane of any point with positive Gaussian curvature touches the surface at a single point, whereas the tangent plane of any point with negative Gaussian curvature cuts the surface. Any point with zero mean curvature has negative or zero Gaussian curvature.
Cross section analysis
Provides a basic (simple) or detailed (advanced) information and corresponding graphic about multiple sections of the interior of solid parts. It also analyzes whether the part adheres to the minimum and maximum wall thickness. Not available in the construction environment. A corresponding set of cross section graphics is displayed in the graphics window.The Simple analysis type generates a cutaway view of the part at a single section plane. The Advanced type provides a table of more detailed information on multiple section areas of the model along with a corresponding cross section graphic.
Differences between analysis commands in the part and construction environments
In the part environment, you can save each analysis and then manage the analyses using the Model browser. The items you can select include faces, quilts, or the entire part solid body.
Analyses you create in the construction environment are only temporary and are removed once the dialog box is closed. In addition to selecting faces and quilts, you can also select groups. You can also select Wires for curvature comb analyses. Cross section analysis is not available in the construction environment.