 Back to
previous stage of 2D Zone Tutorial.
Back to
previous stage of 2D Zone Tutorial.
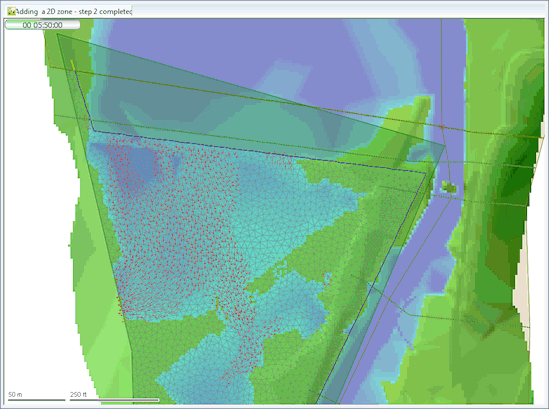
The simulation has created a large number of results, which can now be inspected. Because there are a mix of 1D and 2D results, you can optimise the view of the results in the GeoPlan by adjusting the themes used to view all the results. For this example, applying 2D direction arrows within the 2D zone will allow you to view the flow patterns within the zone. We can combine this with a 'flood-map' to display water depths within the overall confines of the 2D zone, the river reach and the underlying ground model data.
- To start:
- Right-click on the
DWF simulation ( in the
River, Bridge and 2D zone run) and select
Open from the context menu. Alternatively, if you have not completed the previous steps, please use the DWF simulation from the provided transportable database.
- In this case, open the provided transportable database by using the File | Open | Open transportable database menu item.
- In the new
Explorer window that gets displayed with the contents of the transportable database, click on the
 button to expand the River, Bridge and 2D zone run.
- Right-click the DWF simulation and select Copy from the popup menu.
- In the Explorer window of your current database, right-click on the database tree item and select Paste: DWF (with children).
- The Copying of Simulation Results, Ground Models and Time Series Data Objects dialog is displayed informing you that there may be one or more simulations amongst the items to be copied. Such result files may be large, and in some cases, may not need to be copied. For the purpose of this tutorial, we want to copy the simulation data so leave the defaults and click on Continue.
- All the data required for the simulation (network, inflow and level hydrograhs and run group) are copied in a new Model group.
- Drag and drop the DTM ground model onto the GeoPlan. There will be a short pause while InfoWorks ICM interpolates the water levels within each of the three river reaches and the 2D zone. It will also calculate the minimum and maximum water levels over the model area. This is a one-off operation, the results being stored into the database so that when the model is opened in the future, it appears almost instantly. A green progress bar will be shown at the bottom of the screen while the derived results are being calculated and stored.
- Right-click on the
DWF simulation ( in the
River, Bridge and 2D zone run) and select
Open from the context menu. Alternatively, if you have not completed the previous steps, please use the DWF simulation from the provided transportable database.
-
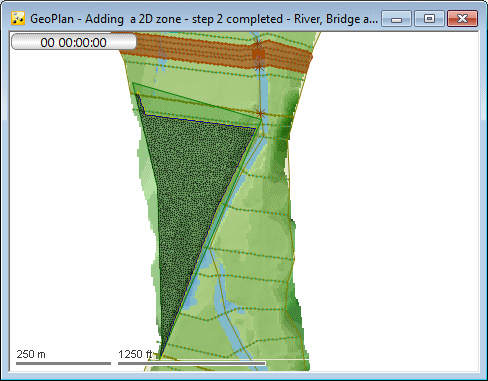
Once the results have been loaded, zoom into the area of the 2D zone and bridge.
-
Set up a theme for 'Flow Arrows' on the 2D zone. Create up to 10 red arrows of varying length and line visibility. Do not show arrows for velocities less than 0.5 m/s. Creating exact settings is not important for this part of the exercise, but a suggested set of parameters is shown below.
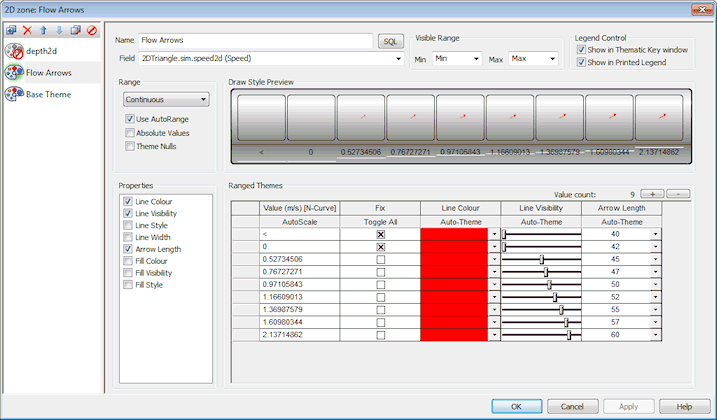
You can experiment with different settings, which you can save to the model or the database once you are happy with the GeoPlan display produced.
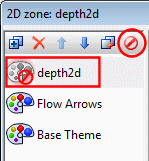
For best results in this model, turn off the setting for showing Element Depth. This is done by selecting the theme and pressing the 'no entry' icon on the specialist toolbar.
-
Finally, ensure the 'flood' theme is active by right clicking on the GeoPlan, selecting Properties & Themes... from the context menu, scrolling to the bottom of the list and ensuring the 'flood' check-box is ticked. Press the Edit button to the right and setup a 'Flood Depth' theme using the AutoRange setting and approximately 9 levels. Use a blue fill colour, representing low depths with light blue and deeper water with dark blue. As before, creating exact settings is not important, but a suggested set of parameters is shown below.
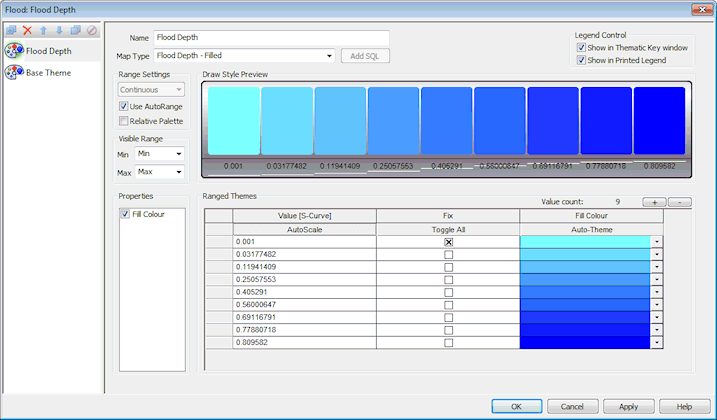
You can experiment with different settings, which you can save to the model or the database once you are happy with the GeoPlan display produced.
 Back to 2D Zone Tutorial
main page.
Back to 2D Zone Tutorial
main page.