The ML Deformer Export Training Results window shows a chart with the training error rate, letting you identify trends during training that affect the deformer's performance, such as overfitting.
To open the ML Deformer Training Results window
- In the ML Deformer Attributes window, right-click the ML Model column and choose View Training Results...
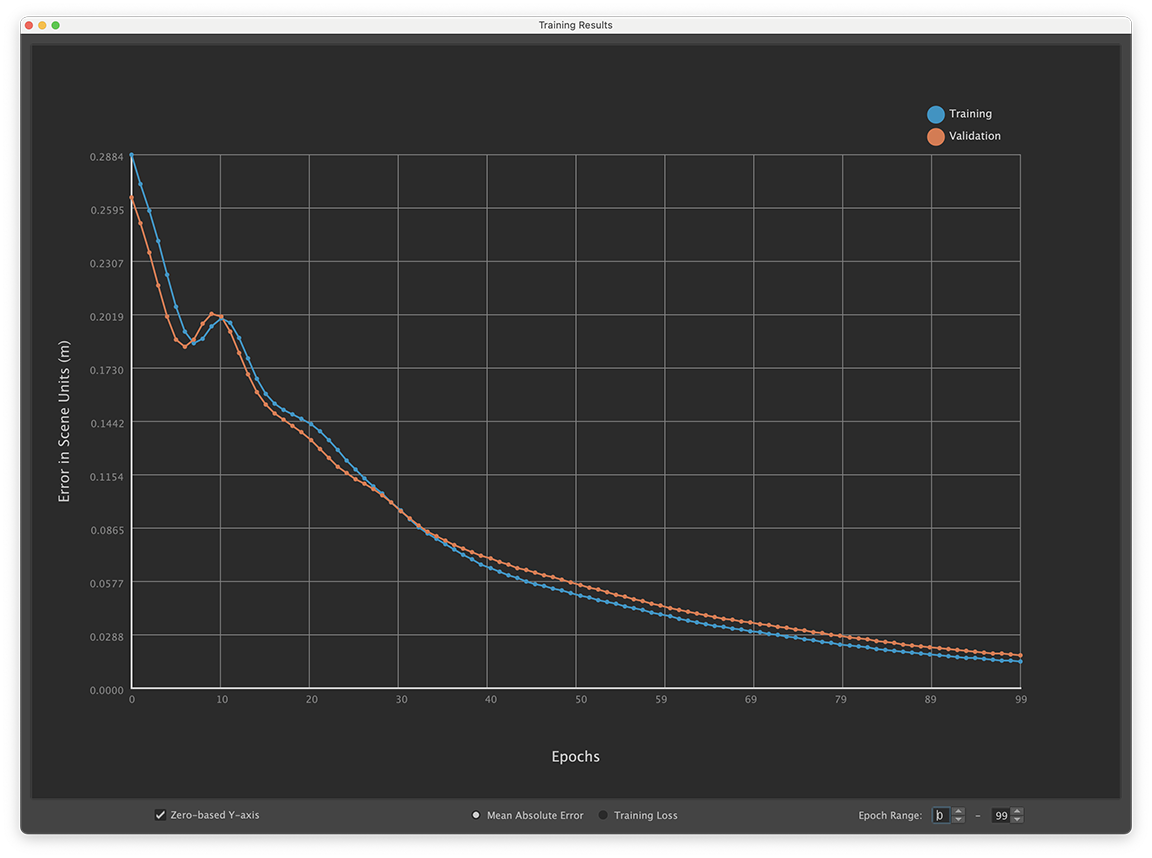
ML Deformer Training Results window
The blue line shows the Training data points and the orange show the Validation data points.
- Zero-based Y-axis
- Activate this setting to have the chart Y-axis of the chart start at zero. Turn off Zero-based Y-axis to have the chart start at the minimum loss in the displayed range. The default setting is active.
- Mean Absolute Error
- Displays the average of how far the generated deltas are from the target deltas, across all vertices and samples for that epoch in scene units (centimeters).
-
Mean Absolute Error is intended to give a sense of how the training loss translates to actual results in the scene. However as it is averaged over the entire trained geometry, it can be misleading if only certain areas have many deformations.
Note: Mean Absolute Error does not have a direct physical meaning if using Principal Shapes, since the error values will be in percentage weights and not deltas.
- Training Loss
- The chart displays the direct loss value that was used to train the ML Deformer. Mean Squared Error calculation is used by default.
- Epoch Range
- Select a range of epochs to plot to avoid a large error in the first few epochs skewing the overall display. Enter a Start and End range in the Epoch value fields.
Hover over the data points to view data about the individual Epochs.
Overfitting
Overfitting is a machine learning concept that happens when the prediction is too similar to the existing data. When a predictive model learns too much detail in the training data, it becomes difficult to apply to new data.
A simple example: imagine a rule to sort apples and oranges by color, where any red fruit would be labelled "Apple", and any orange fruit labelled as "Orange". If the process encounters a green apple, the rule might incorrectly identify it as an Orange. The identification error occurs because the rule was too strict about the initial data, and could not process new data: a green apple. This example would be overfitting and demonstrates the need for multiple variables when making predictions.
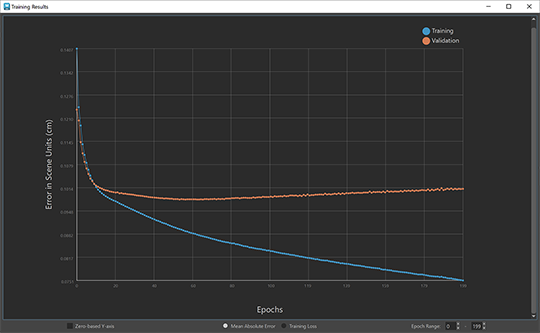
A sign of potential overfitting of the data during learning would be a gap between the error rate for the Training data versus the Validation data. The above screenshot shows an obvious example of overfitting, where there's a large difference between the Training and Validation data points.