
Alerts instances are the actual occurrences of alerts and as such, they are a powerful tool way of informing the user when a significant event has occurred during a simulation. Alert instances are represented in various areas of ICMLive Operator Client:
- In the Alerts and Verification Alerts Window grid.
- On the GeoPlan via the use of themes.
- In results graphs.
- In the Summary Window of the Overview page
Alerts and Verification Alerts Window Grid
The Alerts Window and the Verification Alerts Window are visible within the same context as a simulation result (i.e. they are specific to one simulation).
The grid has the basic functionality expected of grids, such as sorting.
Geoplan Themes
To see alerts as a theme on the GeoPlan, drag and drop the alert instance list object onto the simulation opened in the GeoPlan.
When an Alert Instance List is generated in InfoWorks ICM, at least two new results fields to the corresponding simulation:
- sim.Alert Count
- sim.Alert Priority
For each network object, the value of these new fields is determined by the presence of any alert instances associated with that object. In other words, Sim.Alert Count is the number of alerts associated with that object (at a given time) and Sim.Alert Priority is the priority of the highest priority alert associated with that object (at a given time).
Similarly to simulations, polygon objects (areas of interest) have another two additional results fields added in InfoWorks ICM:
- sim.AOI Alert Count
- sim.AOI Alert Priority
For a polygon, these values are derived from any alert instances associated with objects geographically contained in the polygon. These fields can be themed on like any other results fields. AOI Alert Count and AOI Alert Priority results are usually themed using a GeoExplorer theme. A Geoexplorer theme is needed in the Manifest Deployment object in InfoWorks ICM.
Objects are themed in descending priority of sub-theme, so users would typically assign the Alert theme at the top to override any underlying more standard theme definitions. Please refer to the Theme Precedence topic note for more information.
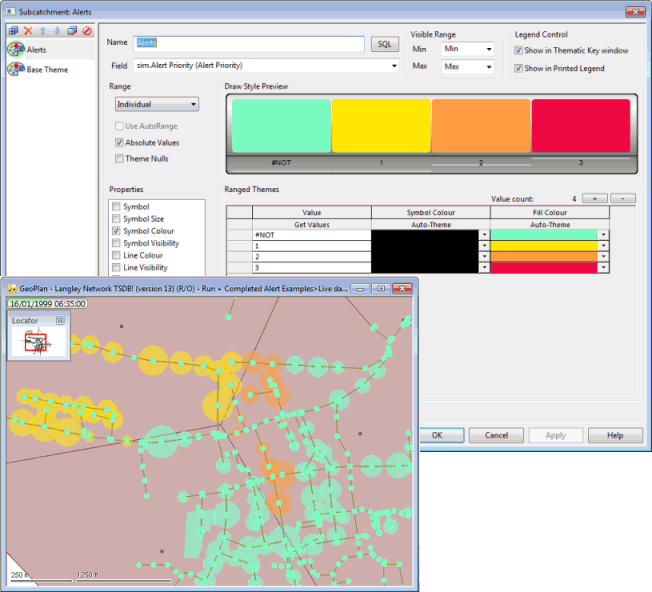
Example of GeoPlan alert theme on a selection of subcatchments for which the rainfall exceeds a given threshold, and corresponding theme attributes
Notes on alert themes and themes for combination / expression alert results
- The Visibility theme attribute of the alert result types Alert Count, Alert Priority, AOI Alert Count and AOI Alert Priority are handled specially in relation to lower theme layers. If for example, the visibility for the criteria ‘no alert’ (i.e. priority is 0 or <) is set to zero, then the theme layers beneath will take effect. This means that usual “hydraulic” themes (e.g. various levels of blue to indicate flood levels) can be set up and that a different alert theme can be implemented using a bright colour that will appear on the GeoPlan at the time the alert is triggered. See the InfoWorks ICM help for more details.
- A Combination/Expression Alert result can be targeted at a specific network object defined in Target B (where available). See the InfoWorks ICM help for more details. In such cases, users can theme on the object type that the alert combination Target B points at. For example, an alert combination may have been set across a set of objects, and the user may target a simple polygon which geographically contains these objects for theming.
- Expression / combination alert types need slightly different handling in the theme context, as they do not related to a specific network object (Target A field). Instead, Target B can be made to point to a network object of the user's choice. The result of the expression / combination alert will be applied to this object, which can then be themed on as usual.
In ICMLive Operator Client, the default theme for the Network Page is defined in the Manifest, and other themes are available in the theme list.
Results graphs
Results graphs can be implemented via
 (Graph) ointhe
Results toolbar. See the
Generating Graph Data for a Network Object section of the
Viewing Simulation Results topic.
(Graph) ointhe
Results toolbar. See the
Generating Graph Data for a Network Object section of the
Viewing Simulation Results topic.
When a results graph is displayed for an object and results field combination that contains an alert, most data relevant to that alert definition is displayed on the graph. In particular, the constant threshold when Target type B is <FIXED VALUE>, or the result of Target B when Target B is pointing at another network object.
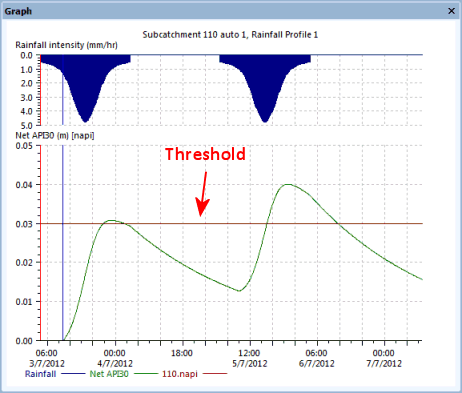
When an alert is defined that includes a Comparison operator and Target type B set to <FIXED VALUE>, you can choose a Graph trace colour that will be used for the threshold colour in the graph.
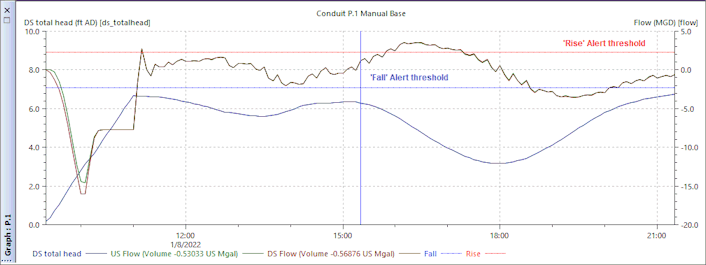
Results graph for a conduit showing Flow, and US and DS total heads attributes, and thresholds for 'Fall' and 'Rise' Alert definitions
See the InfoWorks ICM help for more details on alert definition parameters.
Summary Window
The Summary Window summarises the alert situation for the selected manifest deployment using the results from the latest automatic run for each network/manifest combination. For each Area of Interest polygon, the number of alerts of each priority across the duration of the simulation is counted and summarised in the Executive summary column.