
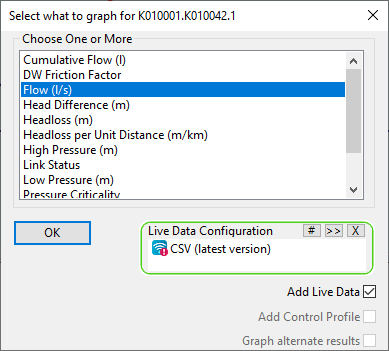
This dialog offers a choice of time varying data to graph. The list will be appropriate to the type of network object selected.
The dialog is displayed when viewing simulation results using the
![]() (Graph) tool on the
Tools toolbar.
(Graph) tool on the
Tools toolbar.
| Item | Description |
|---|---|
| Choose One or More | Lists the attributes that can be graphed. The selected item or items will be graphed. |
| Live Data Configuration |
If live data is associated with the simulation in the current active window, this box will automatically be populated with the associated live data configuration. Alternatively, you can drag and drop a live data configuration to the selection box, or use the Browse button to add one. |
| Add Live Data |
Adds an extra trace showing the live data values coming from Live Data Point, Live Data Feed, or Live Data Composite Feed. Available if the network object for which you are creating a graph has valid live data linked to it, and if an appropriate attribute has been selected for graphing. Tip:
Live Data Feed and
Live Data Composite Feed can be used directly without having to create a
Live Data Point first.
|
| Add Control Profile |
Adds an extra trace showing the control profile values. Available when graphing flow, pressure, or depth attributes for the following objects:
|
| Graph alternate results |
Graphs attributes for both simulations currently loaded in the GeoPlan window. If this option is unchecked, only the results for the first set of simulation results will be graphed. Available when comparing results in a GeoPlan. |
| OK | Displays the Graph view. |