Analyze Processors During Simulations
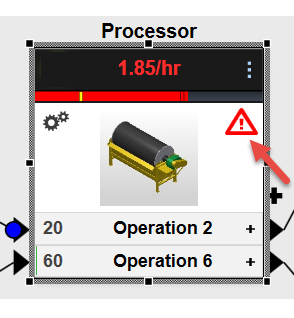
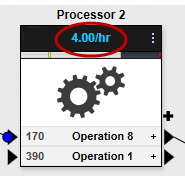
The current production rate appears at the top of the processor.
Hover over the status bar to reveal current measurements:
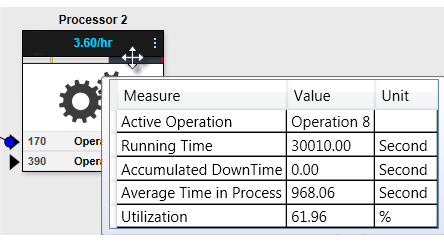
- Active Operation: name of the operation being performed
- Running Time: amount of time needed to process all items
- Accumulated Downtime: total time needed to repair the processor (MTTR)
- Average Time in Process: the total amount of time items were in the processor divided by the number of items processed
- Utilization: running time divided by the total simulation time
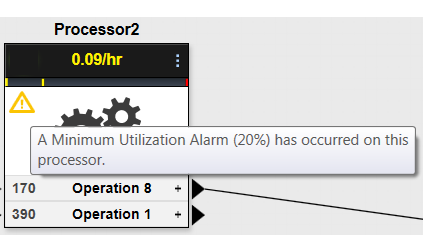
A yellow alarm appears if processor utilization falls below the minimum threshold you set in the Processor Settings window.
A red alarm appears if processor utilization exceeds the maximum threshold you set in the Processor Settings window.