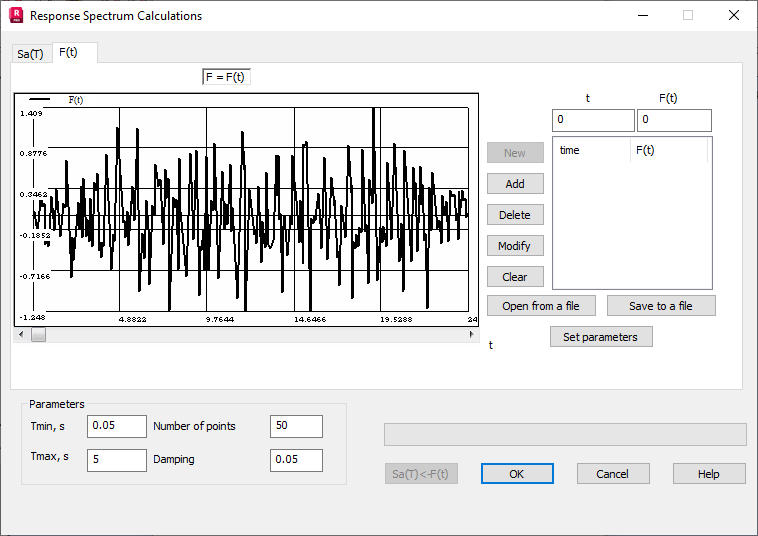
Select the F(t) tab in the Response spectrum calculation dialog to define the time function F(t).

Click Open from a file to read the function from a text file. The file is saved in the following format.
- t1 F1
- t2 F2.
In order to define a new function, click New. Add, Delete and Modify edit a selected line in the table containing columns Time and F(t). Click Set Parameters to stretch or compress the diagram of time analysis F(t) along the time variable axis. Typing 2 x t, 3 x t, … in the Set Parameters dialog scales the diagram and allows you to analyze the details of the time function F(t) when the duration of F(t) process is too long.
After defining a time function F(t), select the Sa(T) tab to change the following default values.
- Tmin - The minimum period recognized during calculations of response spectrum Sa(T)).
- Tmax - The maximum period.
- Number of points defining Sa(T) - The more points defined, the more precise the response spectrum Sa(T) is defined),
- Damping parameter - Expressed as a percentage with respect to the critical value.
Click Sa(T) ← F(t) to obtain the calculated spectrum presented in the form of a green curve.
The selected spectrum (given or calculated) may be saved to a file in the appropriate format.
Click OK button to save the indicated spectrum in the Spectrum definition dialog.
