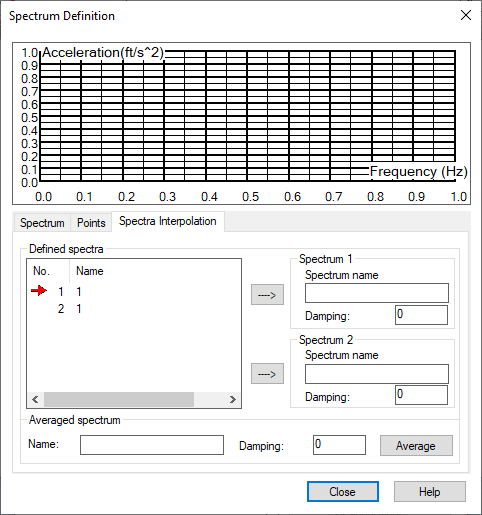
Select the Spectra Interpolation tab in the Spectrum Definition dialog to interpolate spectra.

The upper part of the dialog contains a field with a co-ordinate system in which spectra selected for interpolation and the resulting spectrum are defined. To interpolate spectra, do the following.
- Select the first spectrum and click the upper →. The selected spectrum and its damping values will be shown in appropriate fields. The spectrum diagram will be shown in the coordinate system.
- Select the second spectrum and click the lower →. The selected spectrum and its damping values will be shown in appropriate fields. The spectrum diagram will be shown in the coordinate system .
- Name the resulting spectrum.
- Define the damping value for the resulting spectrum.
- Click Interpolate.
The diagram of the interpolated spectrum will display as red in the coordinate system. The resulting spectrum will also be added to the list of spectra defined to date.
When the interpolated spectra are defined in other interval (for example, one spectrum is defined in the [0;2,5] interval, and the other in the [0;3,0] interval), then the value of the first spectrum will be extrapolated flat in the interval (2,5;3,0).
