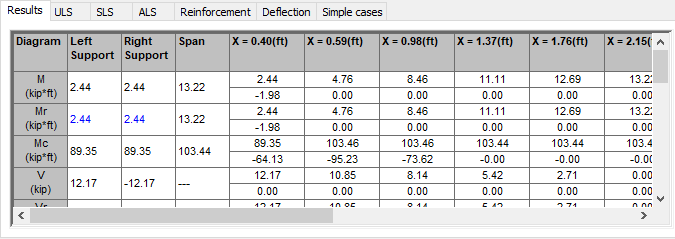
Once the Result tab is selected in the Diagrams dialog box, the box will appear on the screen as shown below.

The tab is made up of a table in which the numeric values of the items selected for presentation may be chosen. The content of the table is related to the category of the results chosen from the scroll list found in the lower part of the dialog box as well as to the selection of the active span (in the case of a multi-span beam). The kind and extent of the displayed results depends also on the settings on the remaining tabs of the Diagrams dialog box.
The table is generally divided into 5 parts:
- the first column (Diagram Type) contains information about the type of the displayed values along with the corresponding units,
- the values presented in the second (Left Support) and third (Right Support) column pertain to the right and left column, respectively,
- the fourth column (Span) is used for presentation of maximum values which occur in the span,
- the remaining columns contain detailed results which are presented along the length of the span.
Options for the result display are located in the Extent field. This field pertains only to diagram presentation. In the case of tables, however, results are always presented for the active span.
The preview of results is possible as required:
- span by span
- for the entire beam.
In the case of a multi-span beam, the selection of the active span is done by pressing one of the buttons, << or >>. They are used to move within the multi-span beam.
The set of presented results may be freely composed. The Robot system allows the presentation of 51 various parameters (moment envelopes, shear force envelopes, reinforcement area, deflections etc.). To simplify the process of result analysis for the user, the following result categories were defined in the program: ULS Forces, SLS Forces, ALS Forces, Reinforcement Area and Deformations. Each of the listed sets contains a logically connected group of results.
Let us, for instance, assume that the user is interested in the theoretical and real bending moment envelopes in connection with the main theoretical (required) and real (provided) reinforcement area, and, at the same time, he wants data to appear when the "SLS Force" set is selected.
To achieve this:
- select the SLS Forces result category from the scroll list found in the lower portion of the Diagrams dialog box.
- on the SLS forces select the following options: theoretical M and capacity Mc; the remaining sets of results are left inactive.
- accept the changes by pressing the APPLY button.
- on the Surfaces tab, select: theoretical (required) Abt and real (provided) Abr; the remaining sets of results are left inactive.
- accept the changes by pressing the APPLY button.
The results of this operation will be shown:
- in the graphic viewer: diagrams of bending moments and the diagrams of the reinforcement area
- in the result dialog box (on the Result tab) tabular set of numeric results.
