
Chapter 13: Controlling Global Results
Previous: Exercise 6 | Next: Chapter 14
Autodesk® CFD has a powerful set of results visualization tools to help view, extract, and present analysis results quickly, easily, and efficiently. A very graphical, CAD-like set of tools as well as several ways to output graphical images and data make communicating analysis results with other members of the design supply chain very easy.
The full suite of visualization tools is available while the scenario is running as well as after completion to provide constant graphical feedback about the analysis. This powerful run-time environment is extremely helpful for understanding the progression of the solution.
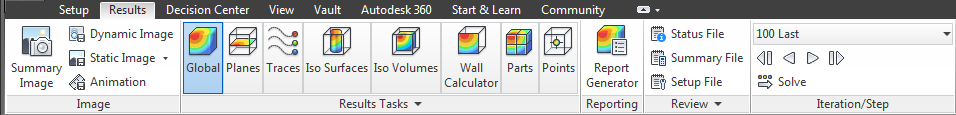
The Results tab is divided into several primary functions:
- Use Global controls to affect the display of results throughout the model.
- Planes are the primary tool for visualizing data on three dimensional models.
- Use Traces to create three dimensional flow path lines through the model.
- Iso Surfaces are surfaces of constant value.
- Iso Volumes are similar to Iso Surfaces, but show the locations in the model that fall between a range of values.
- Use the Wall dialog to calculate flow-induced forces on solid and wall surfaces.
- Use the Part dialog to assess results on selected parts.
- Use the Points dialog to plot the time- or iteration-history at a specific location in the model
To access the Results tasks while in the Setup tasks, click the Results tab.
Global Controls:
![]()
The Global Result
To specify the result quantity displayed on model surfaces, right click, and select Global result:
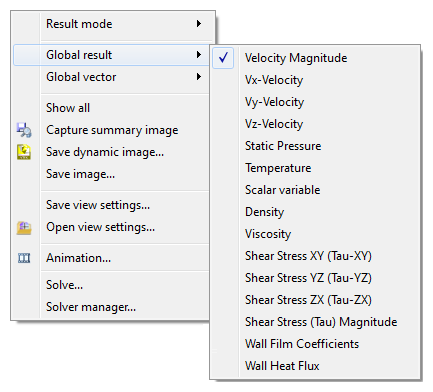
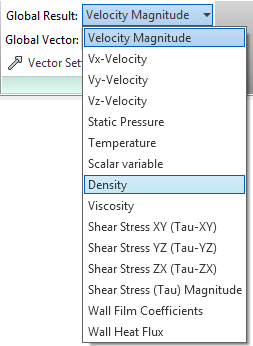
Alternatively, select from the Global Result menu on the Global context panel:
The global result is reflected in the Legend in the graphics window. Changing the units of the Legend changes the output units when probing.
This also sets the result quantity displayed in the Status Bar when probing with the mouse. (To probe, hover the mouse over the location of interest.)
The Global Vector
To display vectors on all fluid surfaces (inlets, outlets, and internal surfaces between fluid regions), right click and select Global vector. Select the desired quantity from the expanding menu list.
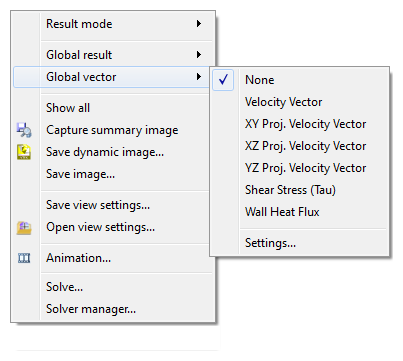
Use the Settings… dialog to control vector attributes such as length and arrowhead size.
Alternatively, select from the Global Vector menu on the Global context panel.
Additional Controls:
Legend
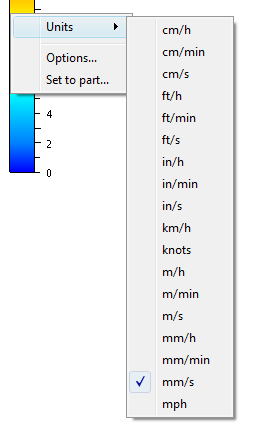
To change displayed units:
Right-click on the legend, and select Units.
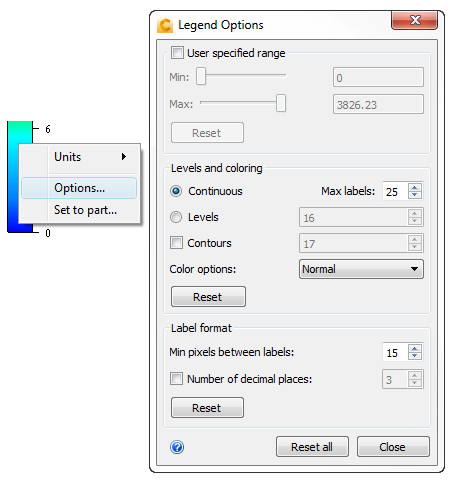
To modify legend appearance:
Right click on the legend, and click Options.
To change the range:
- Check User specified range.
- Adjust the range with the Min and Max sliders.
Levels and Coloring:
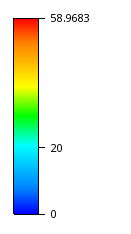
- To show a smooth spectrum, select Continuous:
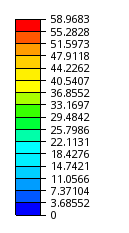
- To show discrete gradations, select Levels:
- To change the legend coloring, select from the Color options menu.
Label spacing and format:
Text labels are automatically added or removed to ensure optimal spacing and to prevent overcrowding.
To change the maximum number of Continuous labels, modify Max labels.
To change the maximum number of labels shown with discrete gradations, change the value adjacent to Levels.
To change the amount of vertical space between labels, modify the value of Mix pixels between labels. The number of labels adjusts to maintain this value.
Legend vertical spacing:
To control the maximum number of legends that can be displayed vertically, click View > Appearance > Legend, and change the value in the spin-box control:
- Increase the value to include more legends in a column. This reduces the size of each legend.
- Reduce the number to allow fewer legends in a column. This increases the size of each legend.
Animation
A very effective way to visualize results from transient analyses is to save results at specific time steps, and animate them to see how they change with time.
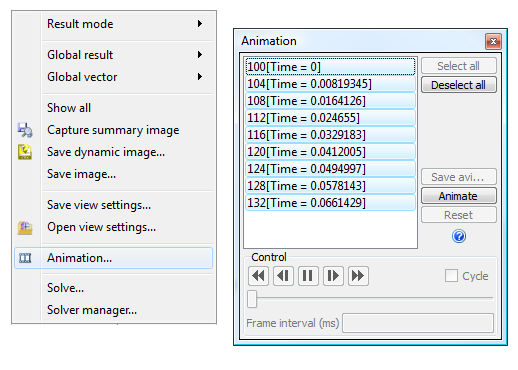
Alternatively, click Results (tab) > Image (panel) > Animation to open the Animation dialog.
Use the Animation dialog to animate saved iterations or time-steps.
To open the Animation dialog:
- Right click off the model, and select Animation..., or
- Click Results > Image > Animation.
To animate results sets:
- To select steps, click on them from the list.
- Click the Animate button.
- Use the "VCR" controls to control the animation.
- To finish animating, click the Reset button.
To save an animation:
- Select Save avi... to export an AVI animated file.