
How To: Run a SAML Trace
To troubleshoot the SSO connection, it is required to check what is sent in the SAML requests. Following are the tools and browser add-ons available to run an SAML trace:
Other network traffic monitors for Internet Explorer like F12 Developer Tools
Following example uses the Google Chrome SAML Tracer extension.
To Execute a SAML Trace
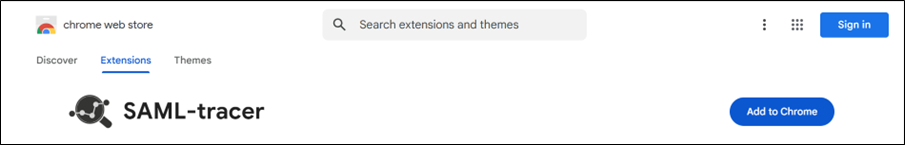
Click Google Chrome SAML tracer from the above list and click Add to Chrome.
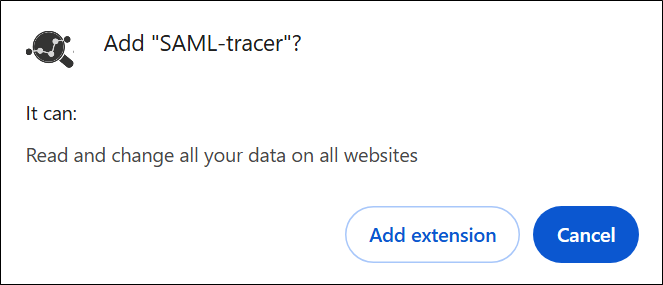
Add SAML tracer is displayed, click Add extension to install in the Chrome menu bar.
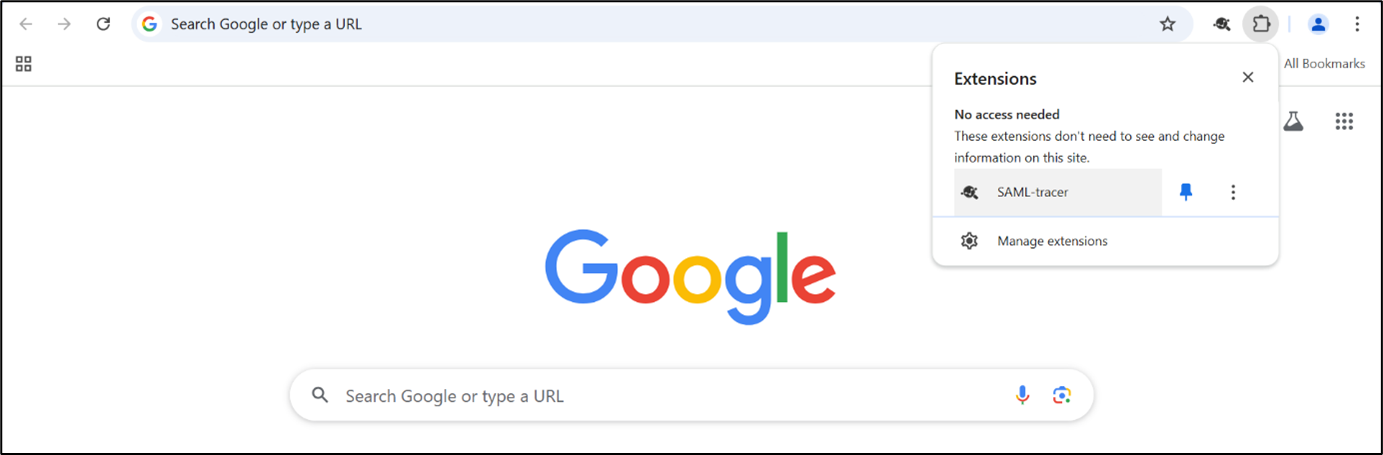
Go to Google chrome click on Extensions icon, click on SAML tracer, and pin it for subsequent ease of use.
Click
 to view the SAML tracer window.
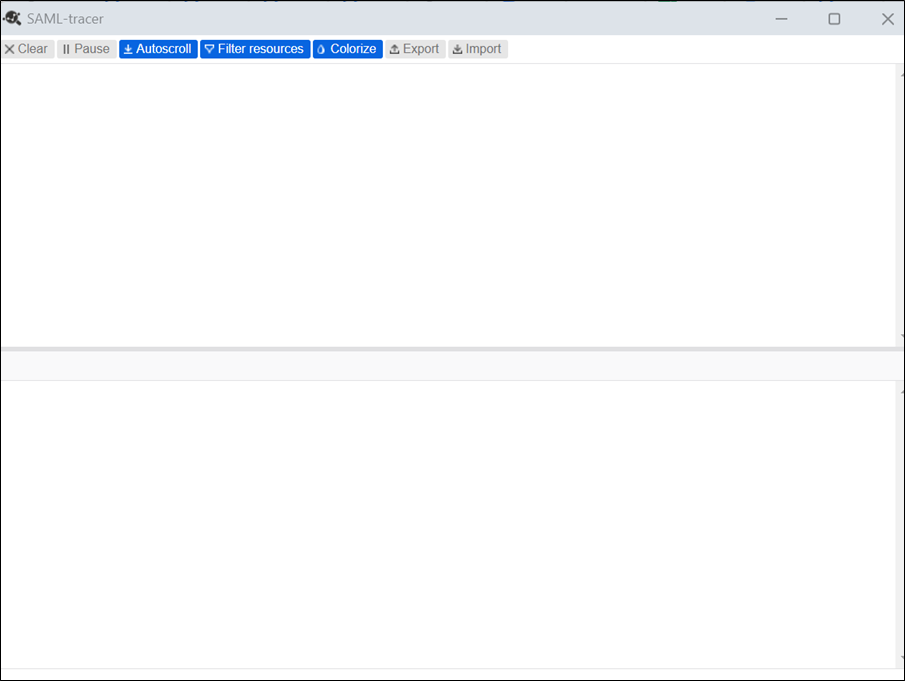
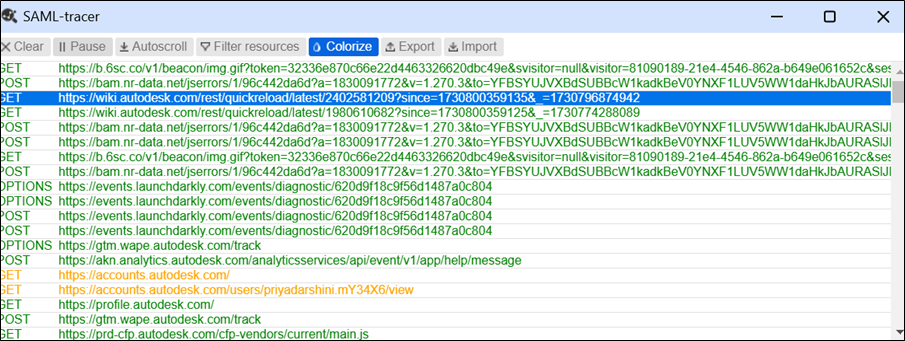
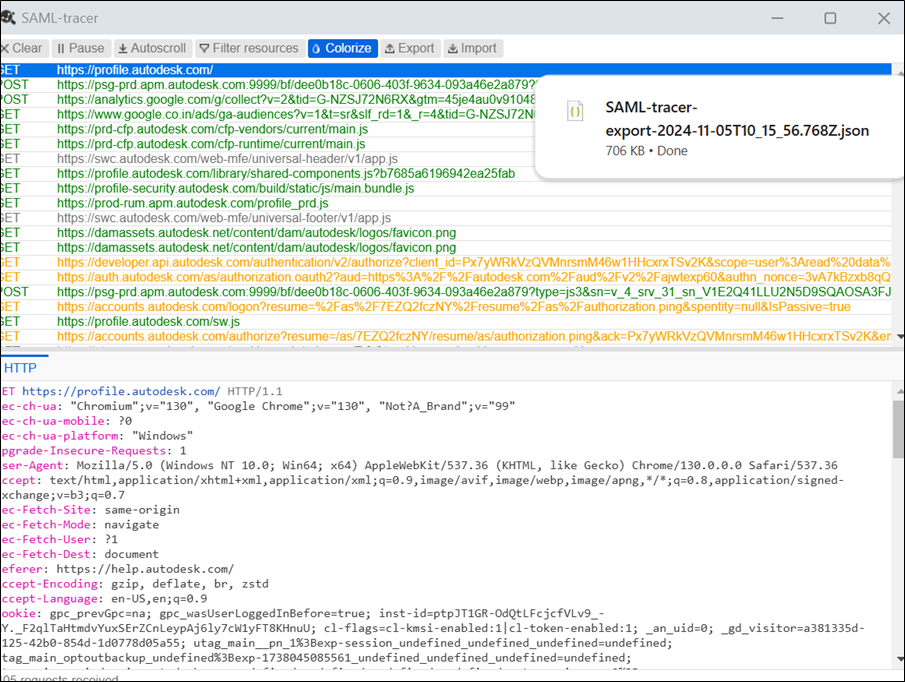
The upper half of the window displays the real-time method entries (GET, POST, etc.), and the lower half is the preview pane that shows all the details of the selected entry.
Ensure to de-select the Filter resources to view all the methods.
Go to https://profile.autodesk.com/ after a successfull SIGN IN.
Note:During the authentication process, if there is an SAML error, an error page is displayed. Otherwise, the SSO login is successfully completed.
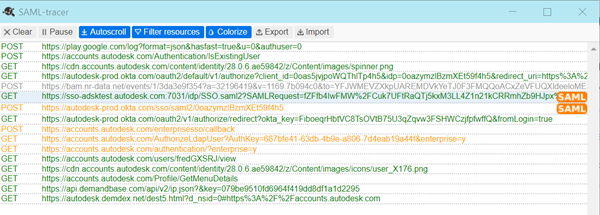
Return to the SAML tracer window, a list of GET and POST entries with the URL is displayed. Some entries are highlighted in orange with a SAML tag, indicating SAML events.
 Note:
Note:The SAML tags appear in the right corner of the entries, denoting SAML events being passed.
Click on an Entry and select the SAML tab in the preview pane to view the SAML information.

Check the body of the assertion to ensure the correct mapping, including the following SAML assertion attributes:
firstName
lastName
email
objectGUID
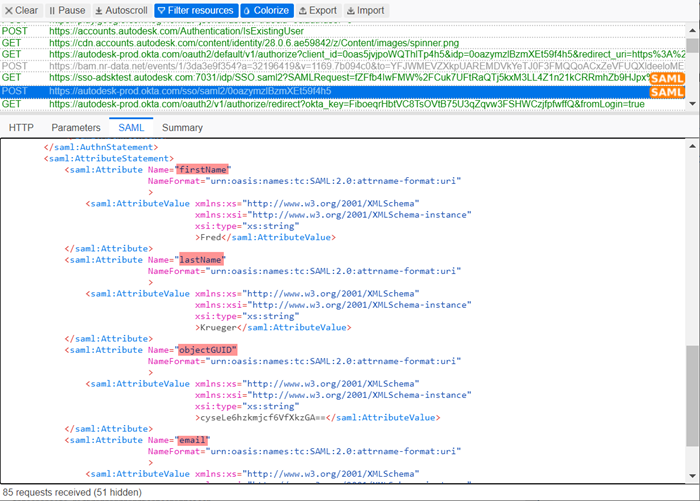
Also, make sure that each of these fields has a value entered.
Note:For ADFS, in addition to the four attributes mentioned, a value for the "Name ID" field is necessary.
To Export the Logs
Click Export in the SAML tracer to view a pop-up Export SAML trace preference.
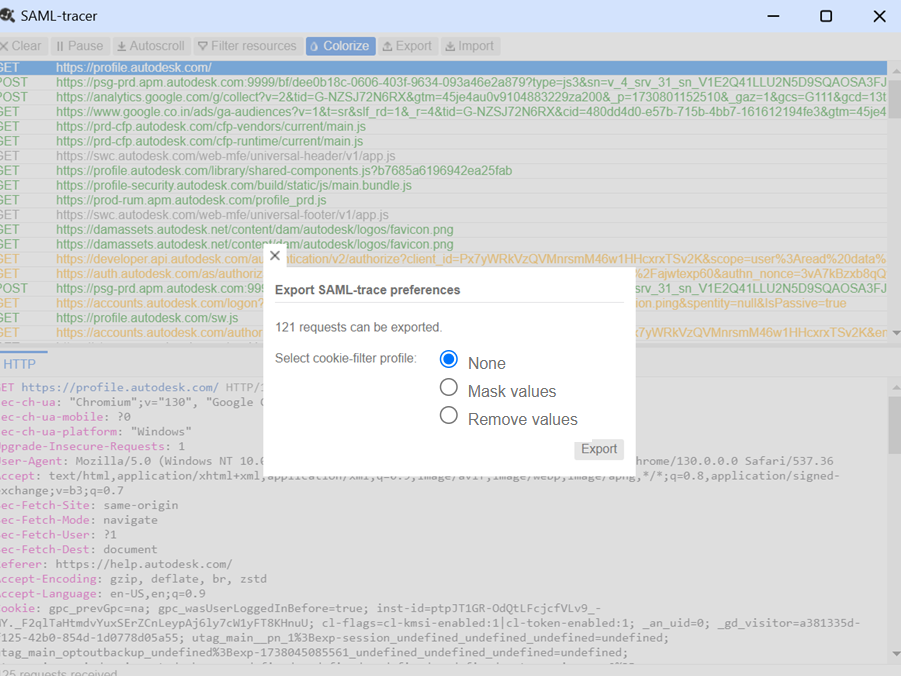
Select appropriate cookie filter and click Export.
A JSON file is downloaded containing log information.
Go to Downloads and open the log file using VS code or Notepad.