
Development and Debugging Tips
Manually kicking off the pipeline
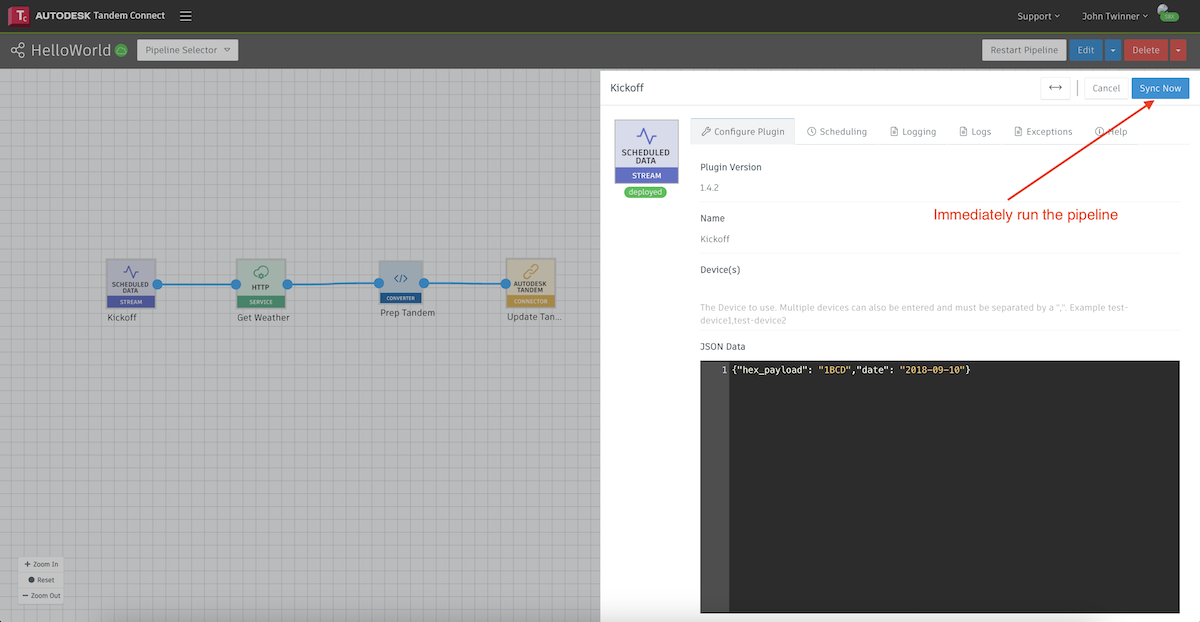
Many times when you are developing the pipeline, you want to immediately run it and see if it works, without waiting until the next scheduled run. As an example, if your pipeline was scheduled to run every 30 minutes, you don't want to wait that long to see the effect of your latest change.
Once the pipeline is deployed, you can double-click on the Scheduled Data Stream node and click on the Sync Now button. That will start the execution of the pipeline, regardless of when the next scheduled run is. Then choose Cancel to return to the canvas and monitor the progress of the pipeline.
Checking pipeline progress
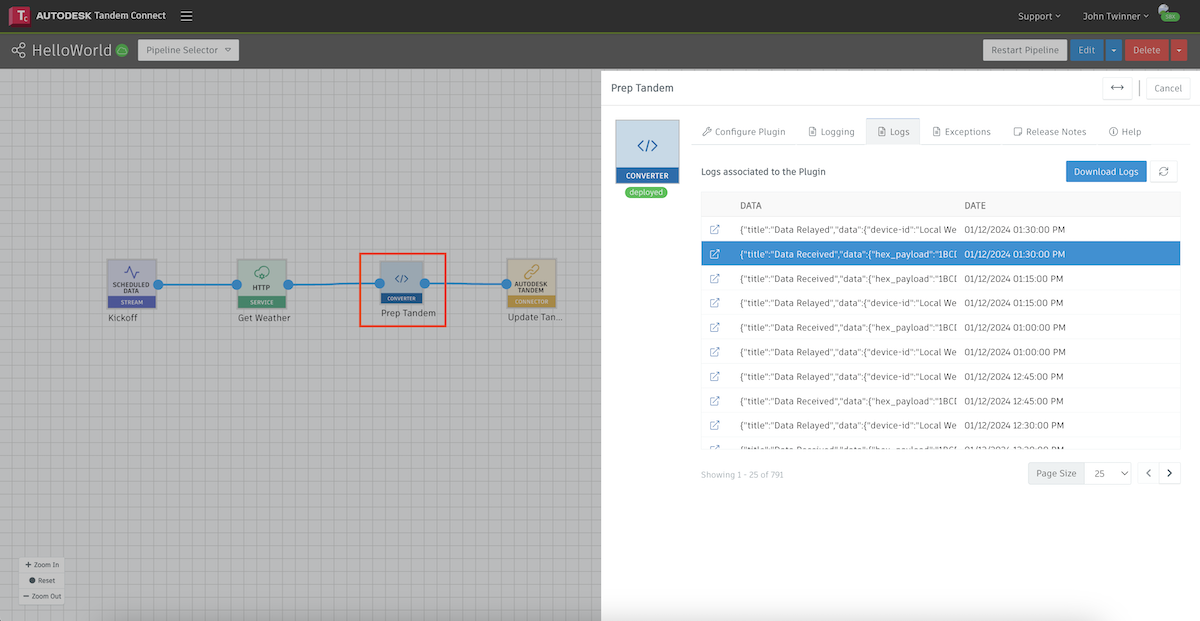
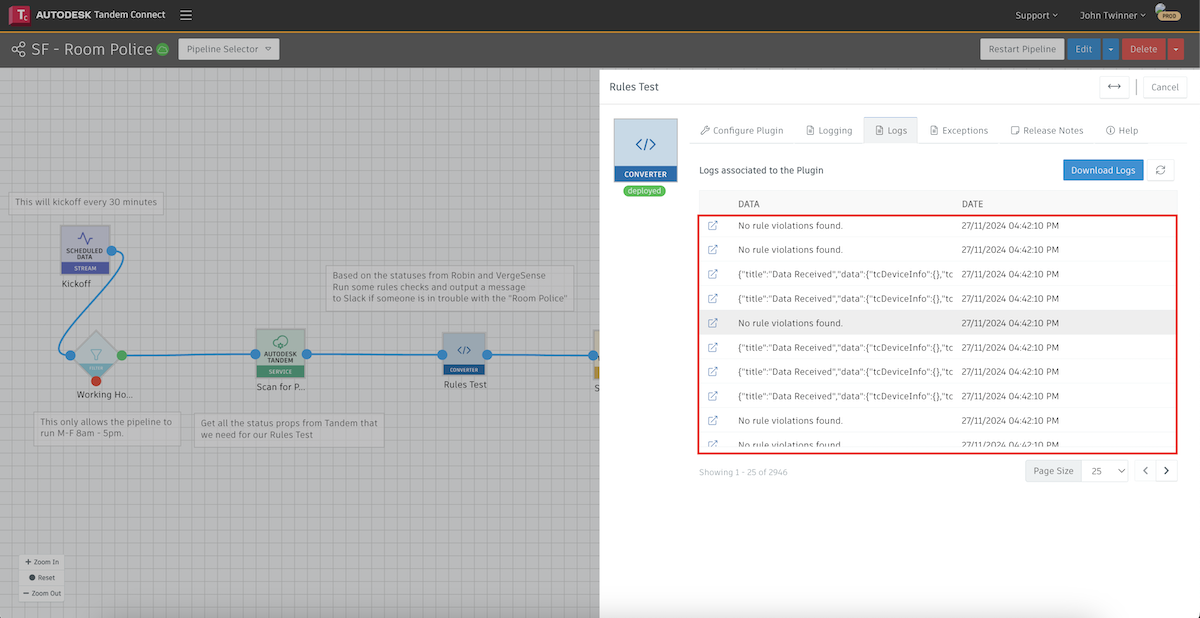
Each plugin node of the pipeline keeps a log of activity. If you double-click on the node you can access the Logs tab and see the recent activities, with the most recent entries at the top.
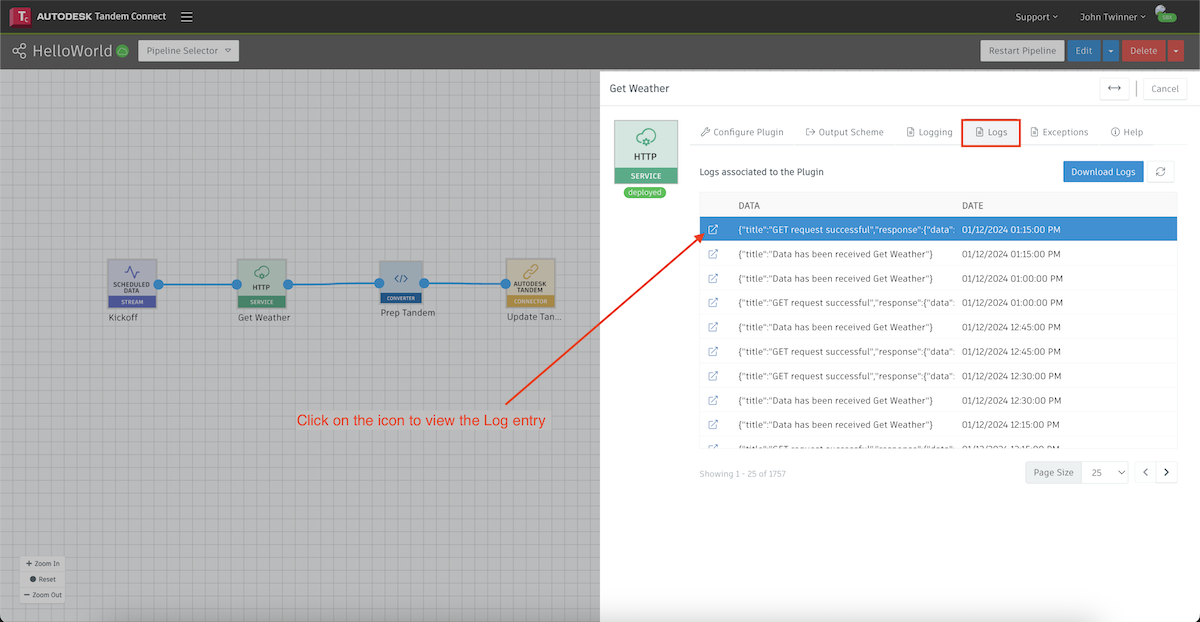
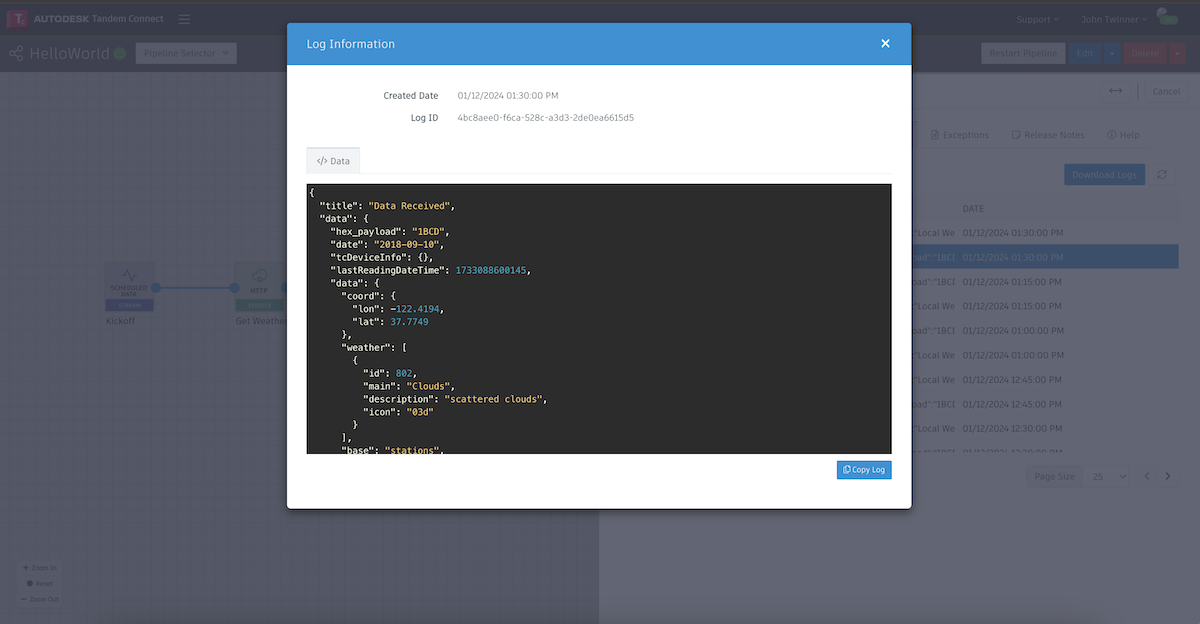
If we click on the icon for a given entry, we can see the log for that event.
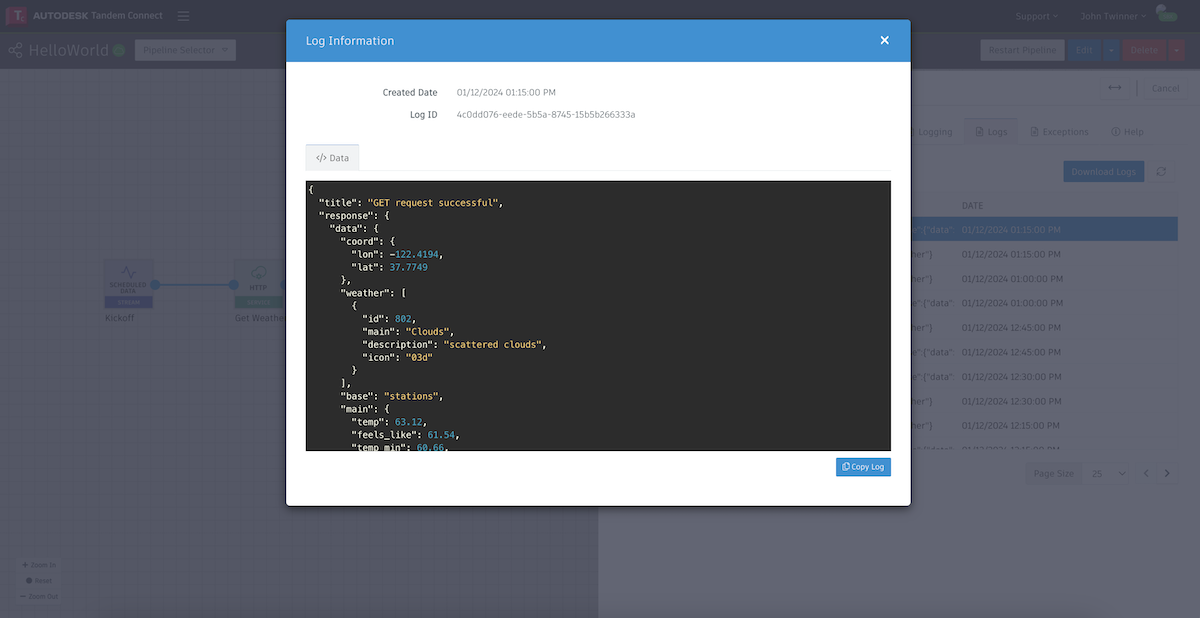
In this case it is showing us the result of a successful call to the OpenWeather service and the data that was returned from that call. This data is usually relevant in the next node of the pipeline and it is often a good idea to copy the log and paste it into a source code editor that understands JSON format. It will make it easier to see how to reference certain fields in the structure.
If the logs are not showing successful retrieval of the data, you might be able to tell what is going wrong by the result in the log, or there may be a clue in the Exceptions tab.
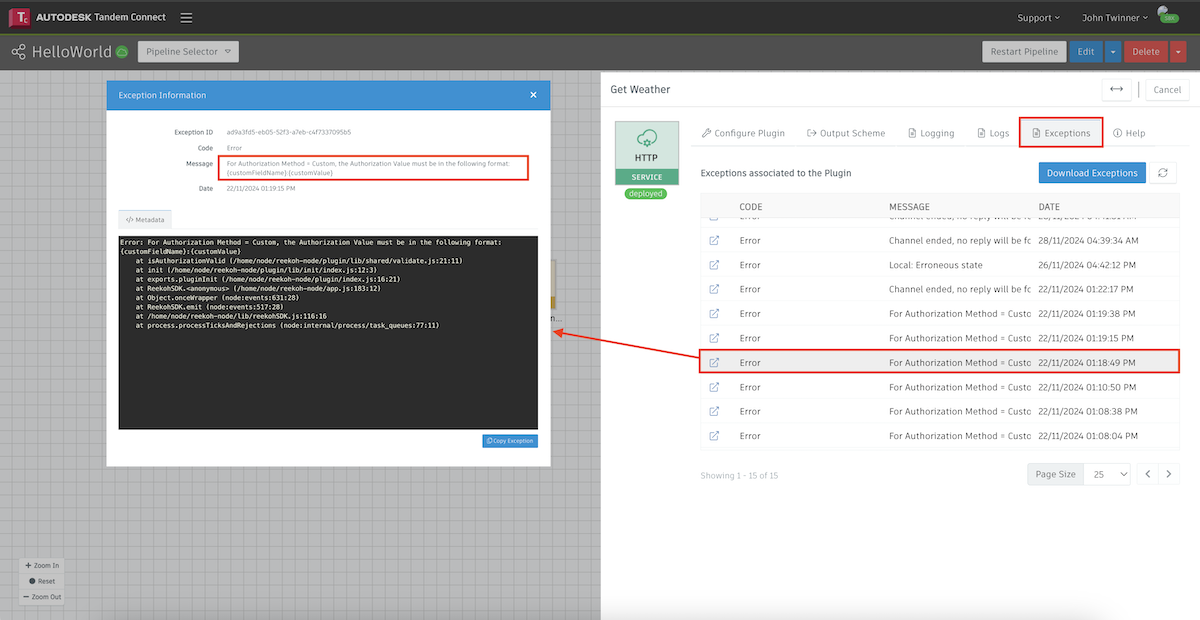
In the example above, we initially had an Authorization exception. The error message gave us a clue that we weren't formatting the argument correctly. After debugging and getting the pipeline to work, we should generally stop seeing exceptions show up. However, there are occassions where the pipeline may stop because the service it has connected to stops sending signals and our plugin finally gives up. You can see some of those messages in the above image.
By examining the Logs and Exceptions tabs on each plugin, you can track the progress and find out how data is flowing through the system and where it might have stopped.
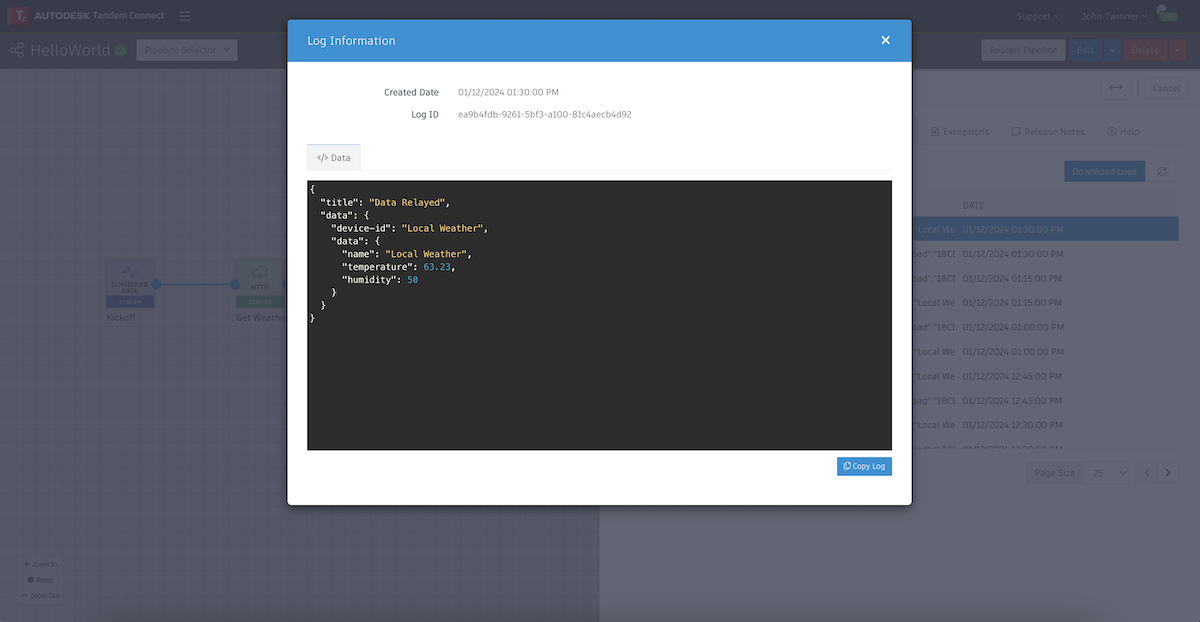
If we go to the next node and double-click on the Converter node, we can see a log for the data the plugin recieved from the previous one ("Data Received"), and a log for the data we are sending on to the next plugin ("Data Relayed").
In this case, our Converter has JavaScript code that takes the incoming data, extracts a few of the fields and then formats it in a way that the next plugin node can process. If we click on the log for the outgoing data, we see what our Converter did.
You can also include branches of logic in your JavaScript code and sometimes it is helpful to print messages to the logger to show which conditions your code is seeing.
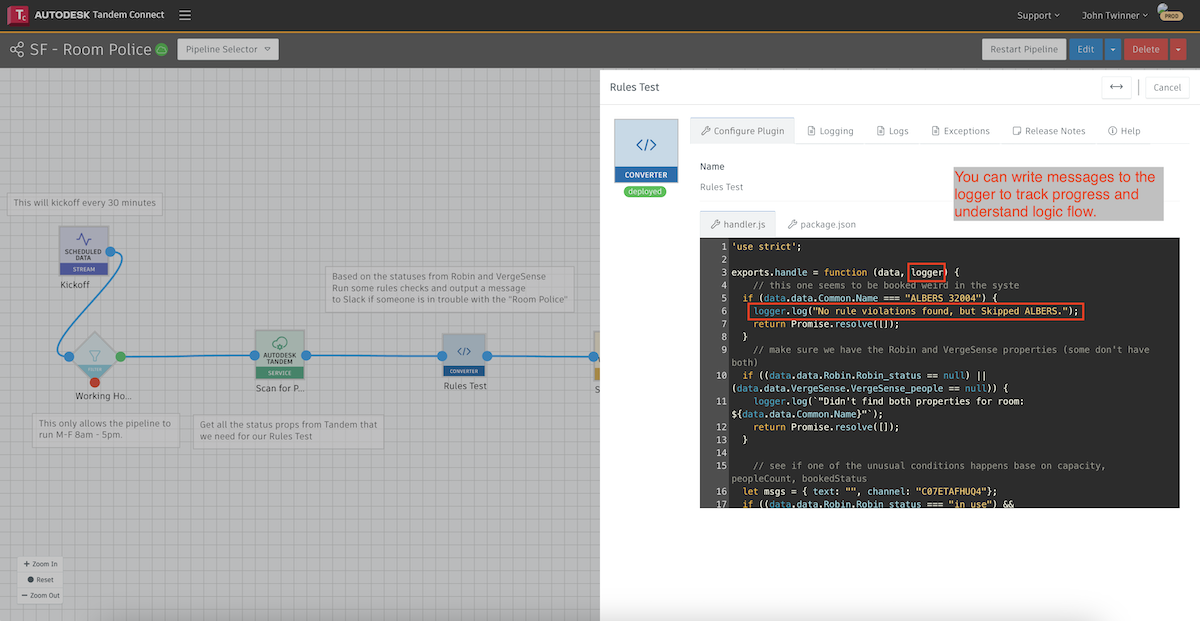
Whatever you print will show up in the Logs and you can come back later and see what conditions your pipeline encountered.
The Edit/Save/Deploy/Execute/Debug cycle
When developing a pipeline, you will go through a cycle several times until you successfully get the pipeline up and running correctly.
- Edit - go into edit mode and add plugins or change the configuration of a plugin.
- Save & Deploy - using the drop down menu next to the Save as Draft button, you can save your changes and redeploy the pipeline. The system will only redeploy the plugins that have actually changed during this Edit cycle.
- Refresh browser to see deployed status - after waiting 10-30 seconds, refresh the browser and make sure the deployment status icon in the upper left is Green and not Yellow. This means your changes have been redeployed, but the pipeline is not necessarily running yet.
- Manually kickoff the pipeline - as described in the beginning of this section, you can kickoff the pipeline by hitting the Sync Now button.
- Examine Logs and Exceptions to debug - as described above, you can inspect the intermediate results for each plugin and make adjustments. Go back to Edit and go through the cycle again until your pipeline is functioning correctly.
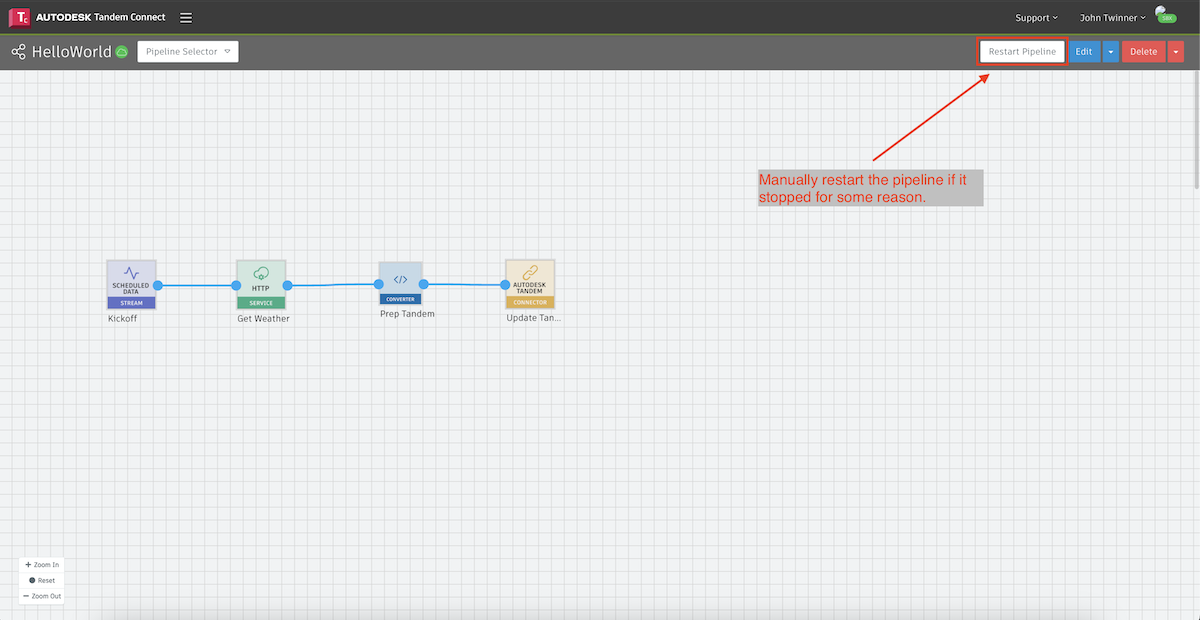
Restarting a pipeline
Once a pipeline is deployed, it should continue to run at the scheduled interval. However, pipelines are a complex orchestration of services in the cloud and sometimes they need to be restarted. If you see that a pipeline that used to funciton properly is not continuing all the way through (most likely by seeing an Exeption in one of the plugins), you can manually restart it by clicking the button below.
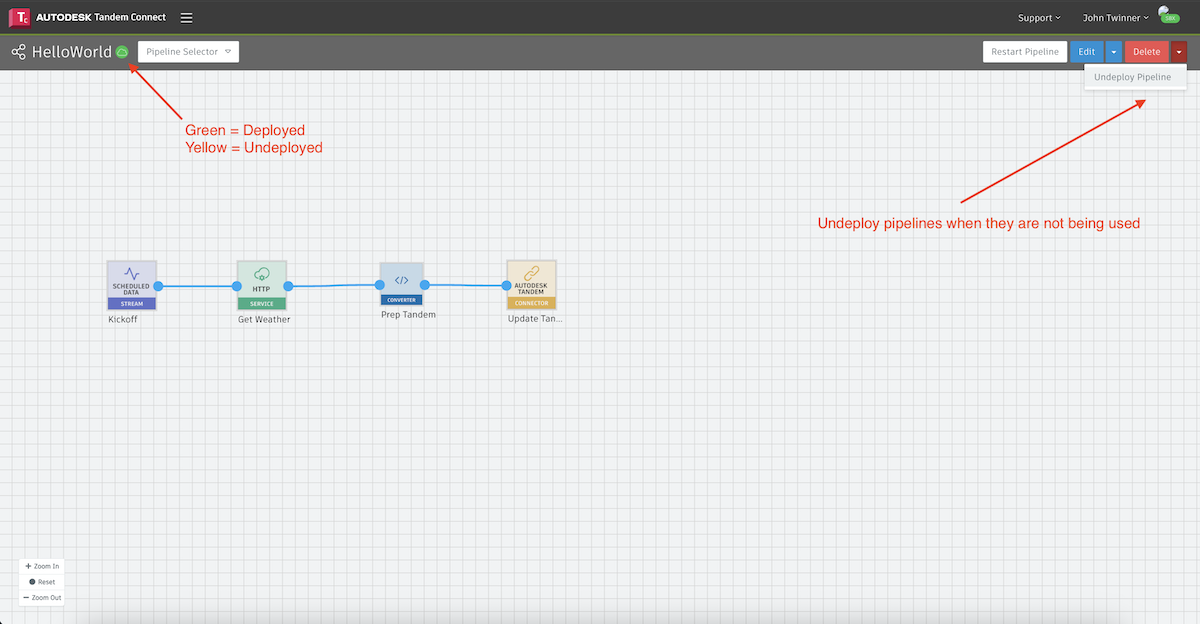
Undeploying a pipeline
Deployed pipelines continue to run and will incur a cost. If you need to stop a pipeline from running, you can Undeploy it. From the dropdown menu next to Delete, simply choose Undeploy Pipeline.
There is a status indicator in the upper left which should change to yellow once it is successfully undeployed.
If you choose to restart the pipeline later, you can go back into the Edit cycle and then choose Save and Deploy.
Copying a pipeline
You may find an occasion where you want to make a copy of an existing pipeline, either to do something similar, or to create a backup copy of it for safe keeping.
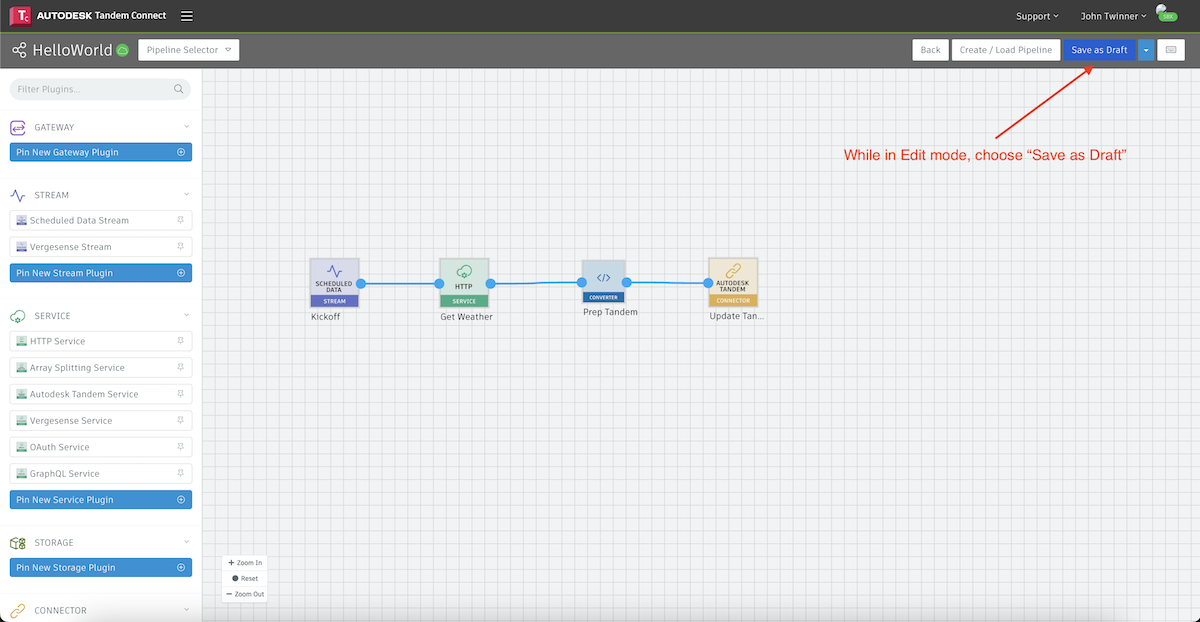
While in Edit mode, choose Save as Draft.
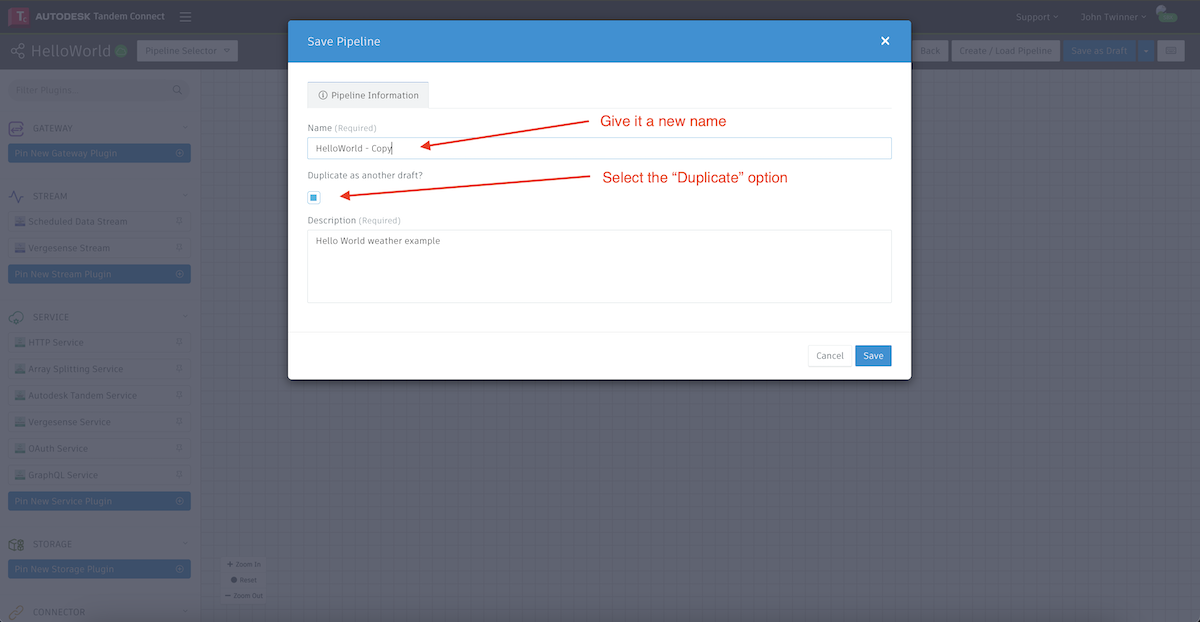
Give the pipeline a new name and make sure to check the "Duplicate" box. This is the equivalent of a "Save As..." operation in most applications.