After the results are loaded into the model, Inventor Nastran puts them under the corresponding subcases, depending on the analysis type.
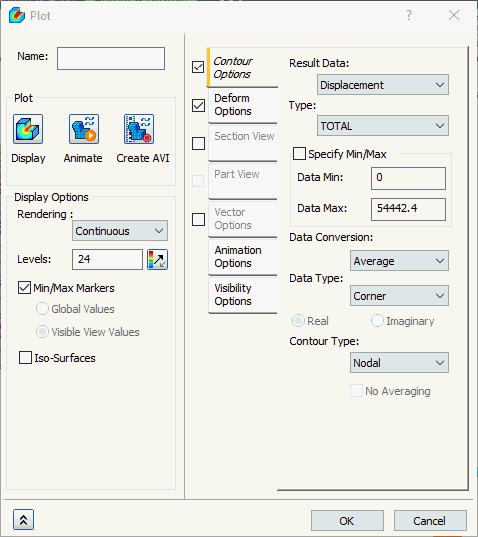
A typical Displacement plot template looks as shown in the figure below.

The form has the following main sections:
- Name: Enter a name for the template, for example,
X- Displacements.
- If it is empty it takes the default result vector as the name of the plot.
- Plot: It has there buttons which are to plot the contour, animate and record an avi file.
- Display Options: It allows changing the rendering, levels and flipping the color bar using color flip button.
- Rendering: Various rendering options are available, like: Point, Line, Continuous, Fringe and Gouraud.
-
Levels:
- You can set the number of contour levels needed in this field, which will adjust the plot and the contour levels accordingly.
- Maximum number of levels allowed is 252.
- Use the Flip Color button (
 ) to invert the legend colors. For example, when viewing the PRINCIPAL C STRESS, the stress with the greatest magnitude is typically compressive, and therefore negative. Flipping the colors makes the most negative stress red instead of blue.
- Max/Min: This option, when checked, flags the nodes with the maximum and minimum values, displaying their corresponding values. When the Section View or Part View mode is active, the following two additional options are available:
- Global Values: Flag the minimum and maximum result for the entire model, even if the area of these results is not currently displayed.
- Visible View Values: Flag the minimum and maximum result considering only the currently visible portion of the model. When this option is chosen, the actual minimum and maximum result for the full model may differ from the values shown.
-
Iso-Surfaces:
- This option, when checked, displays surfaces with the same contour plot level.
- The number of surfaces depends on the number of levels set in the plot.
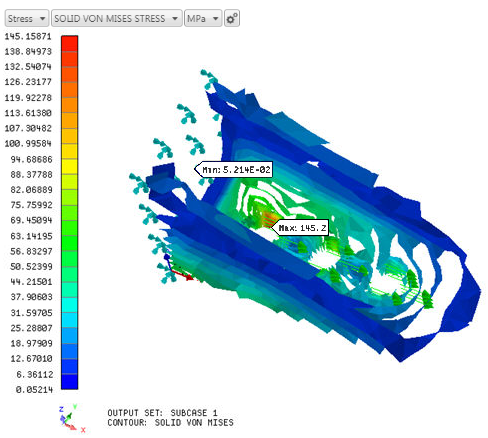
- The example in the figure below shows Iso-Surfaces with 12 levels on a contour plot of the part.

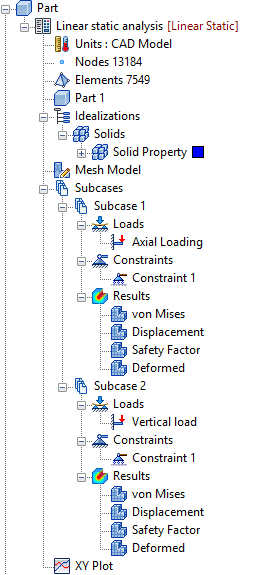
In the example shown in the figure below, the results loaded under 2 different subcases can be seen.

Notice that each set of results has four different plots loaded automatically.
- von Mises: It plots von Mises results with deformed plot.
- Displacement: It plots displacement results with deformed plot.
- Safety Factor: Plots factor of safety. Make sure to define the material allowables and failure theory in the material dialog.
- Deformed: Deformed model only (total displacements).
All the above plots use templates listed under Plot Templates at the bottom of the tree view with default post-processing display settings.
Each of these templates can be dragged and dropped into either a Subcase/Results or mode/increment under a Subcase/Results. Four of these templates are available; more can be created by right-clicking on Plot Templates and selecting New.
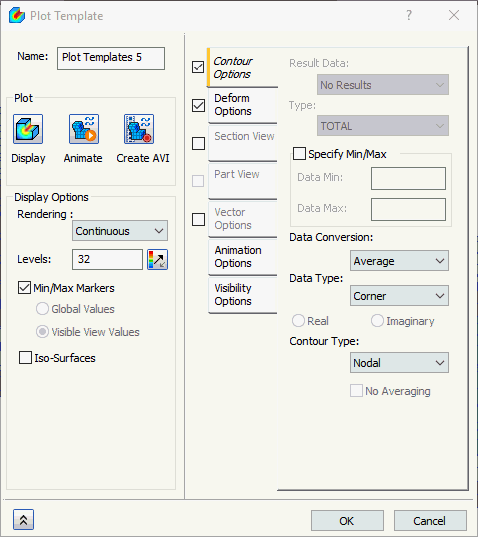
A new template looks as shown in the figure below (varies based on what boxes are checked).

Click on the links at the bottom of the page to see more info on the other sections available in this form.