Note: This stage assumes that you have started
InfoWorks ICM and that the
Explorer window is open, showing the
River example or
Adding a bridge network icon. You should complete the previous stages before starting this stage.
 Back to
previous stage of River Tutorial.
Back to
previous stage of River Tutorial.
Back to
previous stage of Bridge Tutorial.
The simulation has created a large number of results, which you can now inspect. The following screenshots apply to the River tutorial but the same principles apply to the Bridge tutorial and the same tools can be used.
- The results of a simulation can be investigated by inspecting the log of actions performed during the simulation. The log indicates whether there were any problems during the simulation. If there are no problems, you can look at the data created during the simulation in
text form:
- Right-click on the
DWF simulation ( in the
River Run or the
Bridge Run Run Group). Alternatively, if you have not completed the previous steps, please use the DWF simulation from the provided transportable database.
- In this case, open the provided transportable database by using the File | Open | Open transportable database menu item.
- In the new
Explorer window that gets displayed with the contents of the transportable database, click on the
 button to expand the River Run Group (river tutorial) or the Bridge Run Group (bridge tutorial).
- Right-click the DWF simulation and select Copy from the popup menu.
- In the Explorer window of your current database, right-click on the database tree item and select Paste: DWF (with children).
- The Copying of Simulation Results, Ground Models and Time Series Data Objects dialog is displayed informing you that there may be one or more simulations amongst the items to be copied. Such result files may be large, and in some cases, may not need to be copied. For the purpose of this tutorial, we want to copy the simulation data so leave the defaults and click on Continue.
- All the data required for the simulation (network, inflow and level hydrograhs and run group) are copied in a new Model group.
- Drag and drop the DTM ground model onto the GeoPlan.
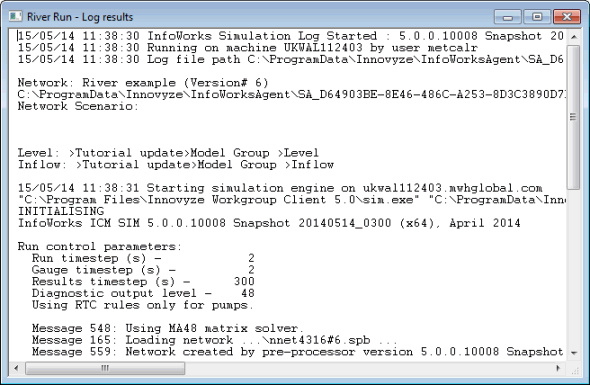
- Select Open As and either select the Log results (text) option or the 'PRN' summary results (text) (the PRN option shows you the raw data) and then click on OK.
- Use the scroll bars to move around the report and check for any messages that indicate that there may have been a problem with the simulation. If there are any problems in the simulation, the data it produces may not be reliable. After checking the log, close the window by clicking on the
 button on the top right-hand corner.
- Right-click on the
DWF simulation ( in the
River Run or the
Bridge Run Run Group). Alternatively, if you have not completed the previous steps, please use the DWF simulation from the provided transportable database.
- Results can be illustrated in the GeoPlan, which gives you the opportunity to
replay a run and see how the network changes over the period of the simulation.
- To view a replay of the simulation:
- Drag the DWF simulation from the Run Group onto the main window. The network is displayed.
- Drag and drop the DTM gridded ground model.
- Use the
Play button (
 ) of the
Replay Control toolbar to replay the simulation or the
Jump / Replay button (
) of the
Replay Control toolbar to replay the simulation or the
Jump / Replay button ( ) to select results for a particular time during the simulation.
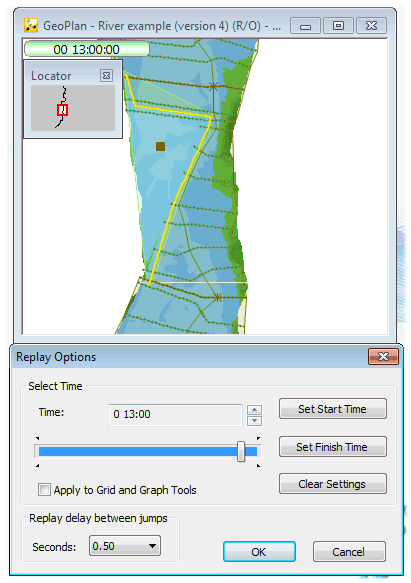
- Using the thematic options, you can monitor the effect of the run on a number of network parameters. For example, you can display flood extents on the GeoPlan by customising the Flood theme.
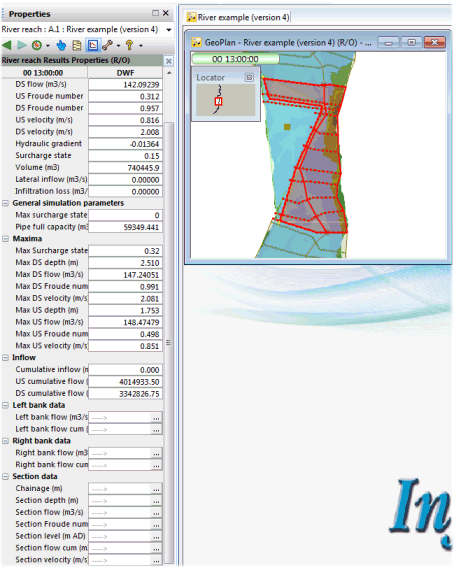
- You can use the
Properties tool (
 ) to display the properties for a link or node.
- The Object Properties window now show the results for the selected object at the current timestep.
- Use the Jump / Replay button to advance the simulation to a particular time before clicking on the object.
- You can display a graph of the effect of the simulation on various parameters for any point in the network. For example, you can view a graph of the flow through a particular link:
- Click on the
Graph button (
 ) on the
Results toolbar and then on the B.1 link. A dialog is displayed, listing the parameters that are available.
) on the
Results toolbar and then on the B.1 link. A dialog is displayed, listing the parameters that are available.
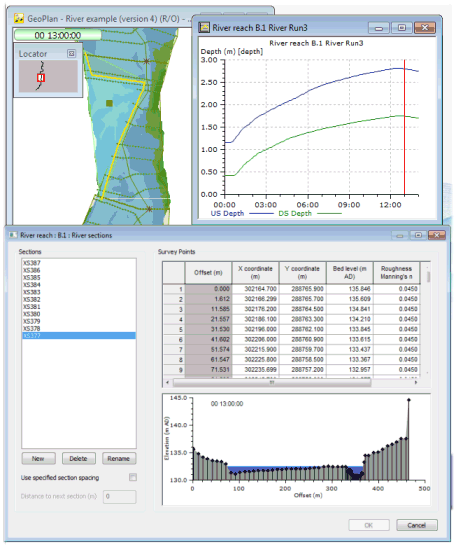
- Select a parameter from the dialog (Depth in the screenshot below) and click on OK. The graph is displayed and can be resized. The vertical red line shows the current time in the simulation.
- You can then select the river reach in the GeoPlan with the
Properties button () and scroll through the sections on the dialog. Every cross section graph shows the water level at the current timestep.
- Click on the
Graph button (
- You can hold down the
CTRL key while clicking on a network object with the
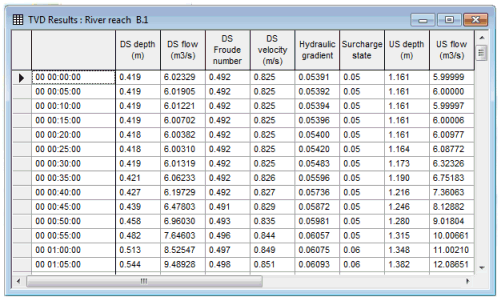
Graph button () to display a grid of results for a particular link or node. Alternatively, you can use the
Grid tool (
 ) and click on the link. Close the grid when you have finished viewing the results.
- To view a replay of the simulation:
- The effect of a rainfall event can be viewed for a particular run of pipes or a specific node by replaying the simulation in the Long Section window or in the 3D Manhole window. Please refer to the Long Section Window or in the 3D Manhole Window topic for further information.
 Back to River Tutorial
main page.
Back to River Tutorial
main page.
Back to Bridge Tutorial
main page.