
You can view flooding results by displaying:
- Flood data as a theme on the GeoPlan View .
- Flood depth at a specific point on the Status Bar.
Flooding Theme in GeoPlan Window and 3D Network Window
You can use ICMLive Operator Client themes to display flood extents on the GeoPlan Window during simulation replay.
You can save the current themes and view the properties of current themes on the Layer Theme Editor .
Flood extents are implemented as follows:
- River reaches - a water surface is triangulated between the known water levels at river sections and along bank lines (all of which are used as breaklines). The link line is also used as a breakline. The river reach polygon is used as a "mask" - you only see water levels within it.
- 2D zones - elements are treated as horizontal surfaces.
- Storage polygons - single horizontal surface for the whole polygon
The depth contours are obtained by subtracting the ground level from this water surface.
These contours are draped onto the ground surface, the river bed/2D element surface and the water surface.
To display flood extents:
- The simulation must include a ground model or 2D meshes prior to carrying out the simulation. Please see the InfoWorks ICM help for more information.
- Right-click the GeoPlan Window and choose Properties and Themes from the popup menu. This displays the Layers and Themes page of the GeoPlan Properties dialog.
- Click Edit in the Theme column for the Flood object layer. The Layer Theme Editor is displayed:
- Change the name of the Flood Depth theme (Name box) if required and select a different map type in the Map Type dropdown.
- Setup your contour parameters following the instructions detailed in the Managing Themes topic and click OK to commit your changes. See Flood Levels Theme Data Fields table below.
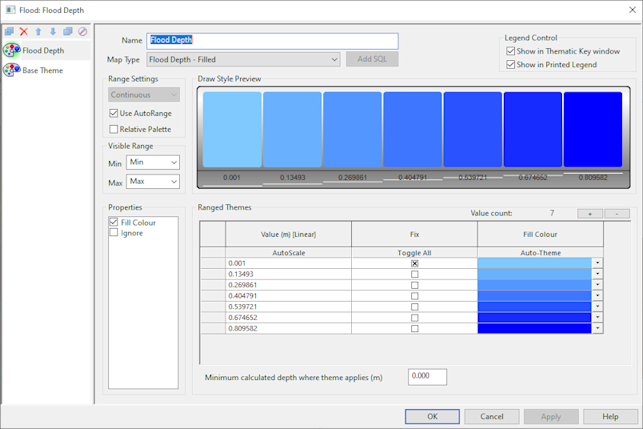
The default Flooding theme is called Flood Depth and is based on flood depth. The default Map Type is Filled but other types are also available (see table below). Fill contours of flood depth values have been auto-themed so the Draw Style Preview shows a graduated set of colours going from light blue for low flood depths to dark blue for high flood depths.
Flood Levels Theme Data Fields
|
Section |
Options |
||||||||||
|---|---|---|---|---|---|---|---|---|---|---|---|
|
Map Type |
The options available in this section depend on the type of Ground Model (Grid or TIN) being used.
|
||||||||||
|
Range Settings |
The only available option is Continuous. This will display the Flood Extents based on a series of ranges of depth.
|
||||||||||
|
Visibility Range |
The Min and Max boxes determine the map scale/zoom level at which the flood mapping is visible. |
||||||||||
|
Ranged Themes |
See Layer Theme Editor for details on how to set up themes using the controls in the Ranged Themes grid. Two important points:
|
||||||||||
|
The Minimum calculated depth where theme applies (m) field is used to specify the depth of the flood results at which the theme should be applied. If this value is exceeded in the results, the flood depths are displayed as specified by the flood theme. If the flood depth results do not exceed the value set in this field, the flood theme will not be applied to those depths on the GeoPlan. Default value is 0. |
Further Tips
Choosing a Map Type
Filled Contours is the most appropriate map type for visual display. If you choose Filled Transparent you will be able to see other information on the GeoPlan through the flooding display. However, this may make the colour variations in the flood display more difficult to see.
Number of Ranges
The larger the number of ranges you choose, the smoother the gradation of colours will be but conversely, the replay will be slower.
One thing you might want to do is just display the flooded outline, without gradations for flood depth. In this case, simply select one range, with the value set to zero. Give the single range a sensible colour such as dark blue.
Fixed Ranges
You may want your ranges to have fixed values, rather than dividing the entire range of flood depths into equal portions. For instance you may want flood contour 0.5 metres apart.
To do this fix the value of the lowest and highest range. You will have to work out what are sensible values to enter.
For example, setting the lowest range to zero, and the highest range to 5, and then choosing eleven ranges, will give a set of ranges covering half metre intervals.
Alternatively you could define the values for all ranges manually, and fix them all.
Point Values in Status Bar
You can also display flood depth at a specific point on the status bar.
To activate the display of point flood depth data:
- Right-click on the GeoPlan Window and choose Properties & Themes from the popup menu. This displays the GeoPlan Properties dialog.
- Switch to the Visual Page.
- Check the Show ground level, flood depth, 2D depth and spatial rain in coordinates panel check box and click OK.
You will now see the ground level and flood depth for the point directly beneath the cursor displayed in the ICMLive Operator Client Status Bar.

X, Y, Ground level, Flood level on Status Bar
The display order in the status bar for the current point is X,Y co-ordinate, ground level, flood depth, 2D depth and spatial rain. A '-' indicates that a height/level is undefined.