
This window displays results for a single network object per page. If an alert is associated with the network object and attribute being graphed, a trace of the alert will be also be displayed on the graph.
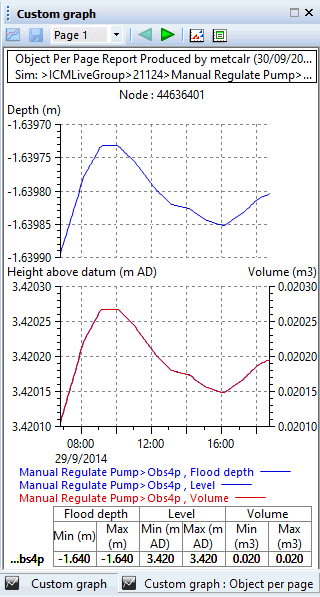
The results to be graphed are configured in the Custom Graph objects in InfoWorks ICM Ultimate or ICMLive Configuration Manager.
To display a custom graph in the Operator, select the graph to be displayed from the custom graph dropdown in the
Results toolbar and click
 (Custom Graphs) located next to the dropdown.
Toolbar

|
|
Graph View toggle. Disabled in ICMLive Operator Client. |
|
|
Save the changes made anywhere on the Custom Graph View. Disabled in ICMLive Operator Client. |
|
|
Go to the desired page. |
|
|
Go to the previous page of the graph view. |
|
|
Go to the next page of the graph view. |
|
|
Graph data as a scatter graph. |
|
|
Export Traces to CSV. Clicking
|


Context menu
Right-click the custom graph window to display a context menu containing the following options:
- Set Comment - allows a one-line comment to be added to the title block
- Include / Exclude Title Block - shows or hides the header text at the top of the graph
- Include / Exclude Statistics Table - shows or hides the statistics table at the bottom of the graph