
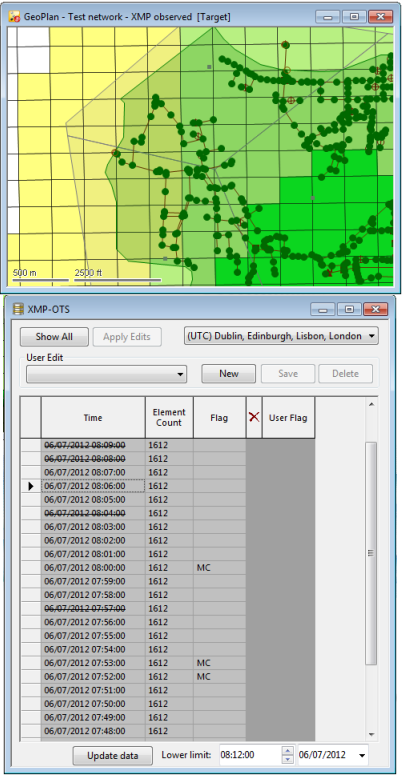
Spatial rainfall can be viewed on the GeoPlan by enabling the display of radar cell boundaries and making use of a Rainfall theme.
You can save the current themes and view the properties of current themes on the Layer Theme Editor or the Thematic Key Window .
To display the spatial rain:
- Open the desired network in the GeoPlan.
- Associate the spatial time series data object, containing the spatial rain of interest to the network currently displayed on the GeoPlan, by dragging and dropping the spatial TSD object from the Explorer window onto the GeoPlan. The name of the spatial TSD is appended to the GeoPlan titlebar and the Time Series Data Grid is displayed. Leave the TSD grid open.
- Right-click on the GeoPlan and choose Properties & themes from the popup menu. This displays the GeoPlan Properties dialog.
- Click Edit in the Theme column for the Rainfall object layer. The Layer Theme Editor is displayed:
- The default rainfall theme is called Rainfall Intensity. It is based on rain intensity and the default Map Type is Filled but other types are also available (see table below). Fill contours of rain intensity values have been auto-themed so the Draw Style Preview displays a set of colours as shown in the image above.
- You can use the default parameters or set up your own as required and click OK to commit your changes. See the Rainfall Theme Data Fields table below.
- Turn on the theme display by checking the Display check box for the Rainfall object layer in the Layers and Themes tab of the GeoPlan Properties dialog.
- It is also possible to turn on radar cell boundaries and status bar values. This step is entirely optional and instructions on how to achieve this are given below:
- Switch to the Visual Page.
- Check the Show radar cell boundaries box to display radar cell boundaries on the GeoPlan.
- If required, also check the
box to display the following information on the
Status Bar:
- ground level (a Ground Model must be loaded in the GeoPlan)
- spatial rain (when a Spatial Time Series Data object is loaded in the GeoPlan) on the Status Bar.
- Click Apply and OK on the GeoPlan Properties dialog (It is also possible to save these settings by using the Save button. See Network editing properties - save options dialog topic for more information on the available saving options).
- Select different rows in the Time Series Data grid and observe the colour changes in the Rainfall theme on the GeoPlan.
Rainfall Theme Data Fields
| Section | Options | ||||||||
|---|---|---|---|---|---|---|---|---|---|
|
Map Type |
The table below contains the available map types for rainfall themes:
|
||||||||
|
Range Settings |
The only available option is Continuous. This will display the Rainfall based on a series of ranges of intensity.
|
||||||||
|
Visibility Range |
The Min and Max boxes determine the map scale/zoom level at which the rainfall is visible. |
||||||||
|
Ranged Themes grid |
Please refer to the Layer Theme Editor topic for details on how to set up themes using the controls in this grid. Two important points:
|