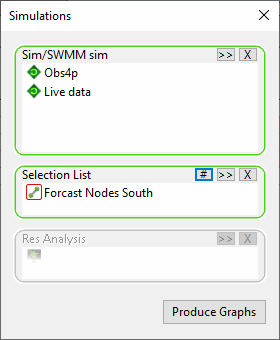
This dialog is used when producing a
Simulation report. It lets you select:
- One or more simulations that contain the results you want to graph.
- The parts of the network to be graphed. You can use either a single Selection list or a Results analysis item.
The dialog is displayed when you select the Graph reports  Simulation report option from the
Results menu.

See below for a description of the dialog and Graph reports for details about using the dialog to produce a Simulations report.
Dialog description
| Item | Description |
|---|---|
| Sim/SWMM sim | A selection box for selecting one or simulation for which results are to be graphed. Choosing a run, instead of a simulation, adds all the simulations belonging to that run. If the current GeoPlan view contains simulation results, this box is automatically populated with the current simulation. |
| Selection List | A
selection list box for identifying objects to be graphed. You can either select a saved
Selection list or click Current ( ) to include all objects selected in the current GeoPlan view. ) to include all objects selected in the current GeoPlan view.
Note: This box is disabled if a Results analysis item is already selected.
|
| Res Analysis | A
selection list box for identifying 2D results analysis objects to be graphed. You can either select a saved
Results analysis item or click Current ( ) to include all
Results analysis objects present in the current GeoPlan View. ) to include all
Results analysis objects present in the current GeoPlan View.
Note: This box is disabled if a Selection list is already selected.
|
| Produce Graphs | Enabled when a simulation and, either a Selection list or
Results analysis item, is selected.
Displays the Parameter Selection dialog where you can choose the object parameters to be graphed. |
