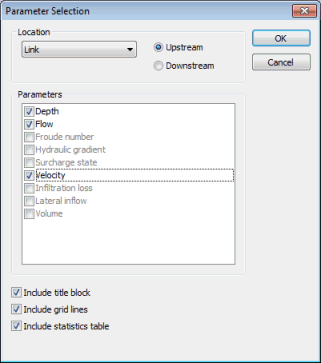
This dialog is used to select which object type and results parameters are to be graphed when producing the graphs for a Location or Simulation report.
It is displayed when you click Produce Graphs on either the Locations or Simulations dialog.

Results can be graphed for selected Nodes, Links, Subcatchments, and for InfoWorks networks only, 2D Point Source, 2D Line Source or Network Results Objects.
See below for a description of the dialog and Graph reports for details about using the dialog to produce a Locations or Simulations report.
Dialog description
| Item | Description |
|---|---|
| Location | A dropdown for the object type to be graphed. Object types available will depend on the selection defined in the
Locations or the
Simulations dialog.
For multiple simulations reports, when plotting Link results, select whether to display results from the Upstream or Downstream end. |
| Parameters | A list of available results parameters for the object type selected in the Location dropdown. You can choose up to a maximum of three results to be graphed by checking the appropriate boxes. |
| Include title block | If checked, the title block is displayed at the top of the Graph view. |
| Include grid lines | If checked, grid lines are displayed in the Graph view. |
| Include statistics table | If checked, the statistics table is displayed at the bottom of the Graph view. |
| The following options are only available when generating a simulation report for objects in an InfoWorks network | |
| Include Rainfall | If checked, the rainfall trace (applies to single simulation reports when graphing nodes, links, subcatchments or 2D results analysis points) is displayed in the Graph view. |
| Include Ground Level | If checked, the ground level trace (applies to single simulation reports when graphing nodes) is displayed in the Graph view. |
| Include Flood Level | If checked, the flood level trace (applies to single simulation reports when graphing nodes) is displayed in the Graph view. |
| Include Soffit Level | If checked, the soffit level trace (applies to single simulation reports when graphing links) is displayed in the Graph view. |
| Include Observed | If checked, TVD connector comparison results (applies when viewing simulations using Scalar TSD only) are displayed in the Graph view. |
