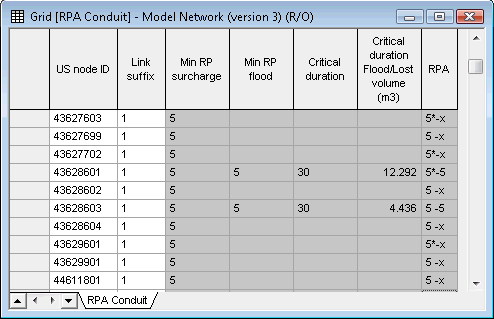
The Return Period Analysis report calculates the return period for events causing surcharging and flooding within a particular system. The return period is the average period between occurrences of an event greater than or equal to a given value. The report lists the results of simulations produced using design storms.

For each conduit, the grid shows the following values:
|
Upstream Node ID |
Upstream node |
|
Link Suffix |
Used with the Upstream Node ID to identify a specific link |
|
Min RP Surcharge |
Minimum return period to cause surcharge in conduit |
|
Min RP Flood |
Minimum return period to cause flood at upstream node |
|
Critical Duration |
Length of storm in minutes that caused the greatest flooding at the upstream node |
|
Critical Duration Flood/Lost Volume |
This is the total flood volume, or total volume lost, at the node in a storm of the critical duration and the minimum return period that causes flooding |
|
RPA |
The RPA table displays the minimum return periods that caused surcharging and flooding. The entries in the table are in the format: Min RP Surcharge - Min RP Flood An asterisk (*) after the surcharging return period signifies surcharging by flow. Note that this is also indicated by a check in the Surcharge due to flow column. A return period may be replaced by an x under the following conditions:
For example, an RPA value of 5-x means that a return period of 5 years caused surcharging in the link, and a return period of more than the maximum caused flooding at the upstream node (or the return period causing flooding at the upstream node could not be determined from selected simulations). |
| Asset ID |
The Asset ID specified for this conduit. |
| Surcharge due to flow | A check in the box indicates that the surcharge is due to flow.
Note that this is also indicated by the use of an asterisk (*) after the surcharging return period in the RPA field, which is retained for compatibility. |
For further details on the Return Period Analysis report, and instructions on how to generate a report and export the data from it as a CSV file or to Info360 Asset, see Grid Reports.
