There are several ways to view results for customer points.
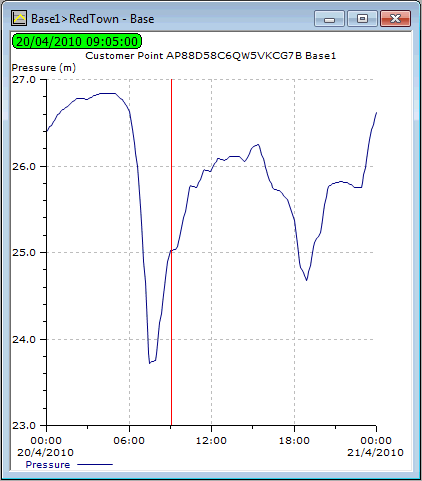
Graphs for individual customer points
To view a graph at an individual customer point, follow the instructions for Graphing data for a network object.
You can also view the same results on a grid.

Graph results for a single customer point
Comparing customer points and nodes
You can use graphing to compare the results at a customer point with those at the node to which it is attached. See Graphing selected objects for further instructions.
Other results
You can view a snapshot of the time varying results for a single customer point on the property sheet. See About results on property sheets.
