
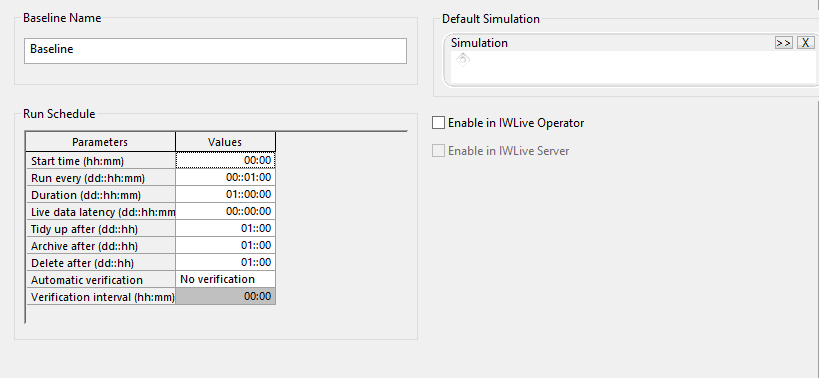
The Baseline property sheet is used to view and edit baseline parameters.
Schedule page
This page is used to specify a name for the baseline, a default simulation and run scheduling parameters.
| Item | Description | ||||||||||||||||||
|---|---|---|---|---|---|---|---|---|---|---|---|---|---|---|---|---|---|---|---|
| Baseline Name | Used throughout the system, for all users. It can be changed at any time. The software will enforce uniqueness. A new name will be visible to all users. | ||||||||||||||||||
| Default Simulation | Provides a default set of data. If the control room operator makes no modifications and if there are no live data updates made, simulations will use the default data as used by the specified simulation. | ||||||||||||||||||
| Enable in IWLive Operator | Implements scheduling and makes the baseline available in the IWLive Operator program. This option will be enabled only when the baseline has been checked in. | ||||||||||||||||||
| Enable in IWLive Server | Implements automated scheduling in IWLive Server. This option will be enabled only when IWLive Server is detected and when the baseline has been checked in. | ||||||||||||||||||
| Run Schedule |
Used to schedule timing of simulations and management of results.
|
Switch page
This page is used to specify data items alternative to the ones used by the default simulation specified on the Default Model page.
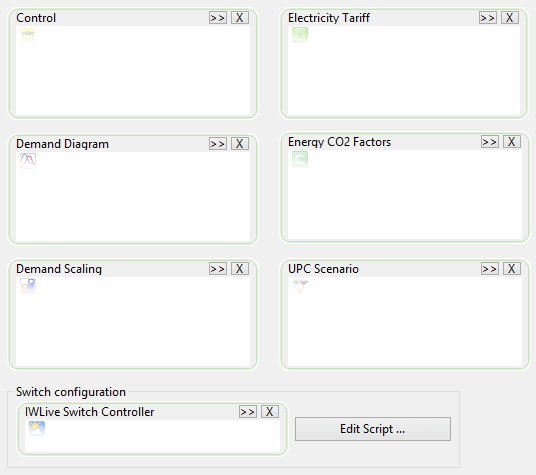
The items to be used in the IWLive projection run will be selected based on the current weather forecast.
| Item | Description | ||||
|---|---|---|---|---|---|
| Control | ~ | ||||
| Electricity Tariff | Electricity Tariffs must contain the same tariff labels as the default simulation Electricity Tariff. | ||||
| Demand Diagram | Demand Diagrams must contain the same demand categories as the default simulation Demand Diagram. | ||||
| Energy CO2 Factors | Energy CO2 Factors must contain the same GHG factor regimes as the default simulation Energy CO2 Factor. | ||||
| Demand Scaling | Demand Scalings must contain the same area codes as the default simulation Demand Scaling. | ||||
| UPC Scenario | ~ | ||||
| Switch configuration |
|
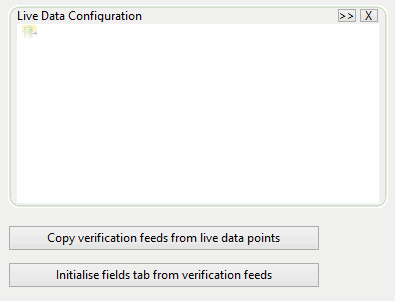
Live Data page
This page is used to select the live data configuration items containing links to the telemetry data associated with objects in the network.
| Item | Description |
|---|---|
| Live Data Configuration | More than one Live Data Configuration may be selected. |
| Copy verification feeds from live data points | ~ |
| Initialise fields tab from verification feeds | ~ |
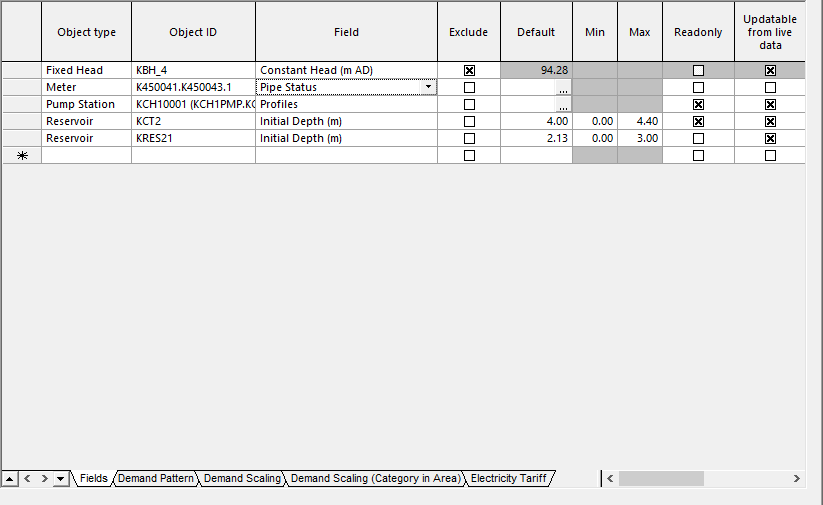
Fields page
The fields page is populated when a valid default simulation is set on the Default Model page.
This page is used to specify updates to be made to controls in the network prior to running a simulation. Updates to demand scaling, demand patterns (inside demand diagrams) and electricity tariffs are also specified here.
- updating from live data
- setting user specified values
- setting from previous projection runs (water quality only).
Data in this page can be entered manually or updated in bulk from CSV files using the Open Data Import Centre.
| Item | Availability | Description | |||||||||||||||
|---|---|---|---|---|---|---|---|---|---|---|---|---|---|---|---|---|---|
|
Object Type |
Available in the Fields tab. |
Displays the type of object to set updates for. This list contains all the available network object types. Entries for demand scaling, demand patterns and electricity tariffs are in their own tabs. Demand scaling, demand patterns and electricity tariffs can be specified using user-defined values or a link to a live data feed. This allows IWLive Pro projection runs to use updated demand scaling / patterns / electricity tariffs. |
|||||||||||||||
|
Object ID |
Available in the Fields tab. |
This displays the settings for individual fields for the selected object. |
|||||||||||||||
| Field | Available in the Fields tab. | ||||||||||||||||
|
Exclude |
Available in the Fields tab. |
If checked, it will not be possible to view this field in IWLive Pro or set this field from IWLive Pro. |
|||||||||||||||
|
Default |
Available in the Fields and Demand Scaling tabs. |
Value to be used when Mode of operation is set to Use default and in some instances when values fall outside of the allowable range defined by the Min and Max fields (see below). These values are initially set from the control or parameter associated with the default simulation set on the Default Model page. A user defined value may be entered. If the field consists of a time varying profile (for example, transfer node flows or demand patterns), click the
|
|||||||||||||||
|
Min |
This field is disabled for non-numeric fields. Available in the Fields, Demand Pattern, Demand Scaling, and Electricity Tariff tabs. |
Minimum allowable value for field initially set by InfoWorks WS Pro. However, a user defined value may be entered. Behaviour is as follows if values fall outside of the allowable range:
(If Mode of operation is set to Default, default values are always used.) |
|||||||||||||||
|
Max |
This field is disabled for non-numeric fields.
Available in the Fields, Demand Pattern, Demand Scaling, and Electricity Tariff tabs. |
Maximum allowable value for field initially set by InfoWorks WS Pro. However, a user defined value may be entered. Behaviour is as follows if values fall outside of the allowable range:
(If Mode of operation set to Default, default values are always used.) |
|||||||||||||||
|
Readonly |
Available in the Fields tab.
Disabled for Demand Pattern, Demand Scaling, and Electricity Tariff. |
Check this option to prevent editing of the field in IWLive Pro. |
|||||||||||||||
|
Updatable from live data |
Available in the Fields and Electricity Tariff tabs. |
Check this option to update the field from live data prior to running the simulation. |
|||||||||||||||
|
Live data feed 1 |
Available in the Fields, Demand Pattern, Demand Scaling, and Electricity Tariff tabs. |
Drop-down list of live data configuration objects specified in the Live Data page. Select the live data configuration containing links to the telemetry point associated with the currently selected network object, demand scaling, demand pattern or electricity tariff. |
|||||||||||||||
|
Live data feed 2 |
Available in the Fields tab. |
Drop-down list of live data configuration objects specified in the Live Data Options page. Select the live data configuration containing links to the telemetry point associated with the currently selected network object, demand scaling, demand pattern or electricity tariff. |
|||||||||||||||
|
Live data feeds |
Available for BalanceNet Volume Constraints only. |
Click the
|
|||||||||||||||
| Mode of operation | Available in the Fields, Demand Pattern, Demand Scaling, and Electricity Tariff tabs. |
Defines the method to be used to update the field.
|
|||||||||||||||
|
Ignore validation limits |
Enabled when Mode of operation is set to Use override. |
Check this option to ignore values set in the Min and Max fields. |
|||||||||||||||
|
Override value |
Available in the Fields, Demand Pattern, Demand Scaling, and Electricity Tariff tabs. |
Specify a value to be used when Mode of operation is set to Use override. Note: If an override value is below the Min value or above the Max value (see above),
IWLive Pro will take the override into account but will clamp the value so it is within the allowable range.
|
|||||||||||||||
|
Forecast unit |
Enabled when Mode of operation is set to Forecast. |
Used in conjunction with Forecast value to specify a time offset for the telemetry data to be used. Specify the unit to be used (days or weeks). |
|||||||||||||||
|
Forecast value |
Enabled when Mode of operation is set to Forecast. |
Used in conjunction with Forecast unit to specify a time offset for the telemetry data to be used.
|
|||||||||||||||
|
Setting delay |
Available in the Fields tab. |
For use in response runs in IWLive Pro. The time it will take for an action in response to an event to be performed (for example, visiting a valve to change the setting). |
|||||||||||||||
| Demand category | Available in the Demand Pattern, Demand Scaling, and Demand Scaling (Category in Area) tabs. | ||||||||||||||||
|
Demand pattern mode |
Available in the Demand Pattern tab. |
Define the demand pattern mode. There are four available options:
|
|||||||||||||||
|
Demand Area |
Available in the Demand Scaling and Demand Scaling (Category in Area) tabs. |
Select an area code. |
|||||||||||||||
|
Tariff |
Available in the Electricity Tariff tab. |
Select an electricity tariff. |
|||||||||||||||
|
DemandWatch |
Enabled in the Demand Scaling tab, and only for areas for which Updatable from live data has been enabled |
Check this option to indicate that the specified live data feed originates from DemandWatch. The integration with DemandWatch is performed in the Fields tab of the baseline, by setting values for the Demand Scaling and Demand Scaling (Category in Area) object types. Instructions are given here. |
|||||||||||||||
|
DemandWatch Mode |
Enabled in the Demand Scaling (Category in Area) tab, and only for categories used in areas for which Updatable from live data and DemandWatch have been enabled This field will be disabled (greyed out) for categories that are irrelevant to the area selected in the Area drop-down list. It will also be automatically defaulted to None. |
Available options are:
|
|||||||||||||||
|
Additional options |
Available in the Demand Scaling tab. |
Scaling Ratio - display demand using scaling ratios. Demand Category - apply scale factors to demand grouped by demand category. Note that demand scaling values are reset whenever one radio button is selected or deselected in order to maintain setting integrity. |
|||||||||||||||
| Context menu |
Sort ascending/descending: Allows you to sort the data in the report in ascending or descending order. Select and find in GeoPlan: Allows you to select and locate the affected properties in the GeoPlan. |
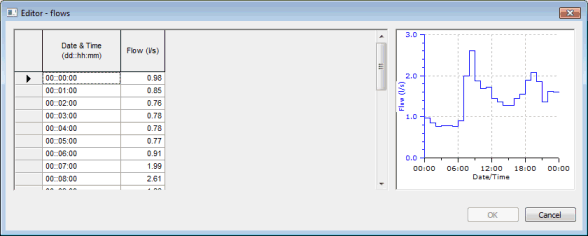
 button to display a profile editor. The profile editor contains a grid of time varying values, where the Date & Time field is in the format dd:hh::mm and is the relative time from the start date time of the control data. A graph of the profile may also be displayed depending on the parameter being viewed.
Resetting to default values
All the values in a row can be reset to the default values of the corresponding control by selecting a row in the Fields grid and choosing the Reset row to default values option from the context menu.
Important note about pump stations
Pump stations have an extra field called Pump Station Live Control. Pump Station Live Control is an array of control statements ordered by time that override any rules or controls (for example, UPC settings) that may have been specified when runs were set up. Values entered in Pump Station Live Control are only applied to runs performed in InfoWorks WS Pro that are to be used in IWLive Pro.
The Live Control parameter is different from the other fields in that it allows users to change a value after time zero, as opposed to at initialisation time. Please note that you will need to enter a duration.
Verification page
This page is used to set links to metered data to be compared with model results. Verification can be used to check how well the model is performing, and also to identify potential areas that may have unidentified leakage, or slow-to-emerge problems.
Automated verification is enabled on the Default Model page. Ad hoc verification can be implemented in the IWLive Pro operator program.
Data in this page can be entered manually, or updated in bulk from CSV files using the Open Data Import Centre.
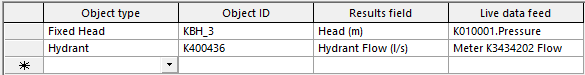
| Item | Description |
|---|---|
| Object Type | The types of object available for setting up verification. |
| Object ID |
The IDs of specific objects that can be set up for verification. Tip: The Select on GeoPlan option is available from the drop-down list. This option allows you to select network objects on the GeoPlan, which will populate that certain cell.
|
| Results field | The results fields available for the selected object. |
| Live data feed | Contains drop-downs of the names of the live data feeds specified in the live data object (if it is present on the Live Data Options page). |
| Context menu |
Sort ascending/descending: Allows you to sort the data in the report in ascending or descending order. Select and find in GeoPlan: Allows you to select and locate the affected properties in the GeoPlan. |
Important note about PressureWatch and QualWatch
- Pressure, Flow or Level for PressureWatch
- Concentration for QualWatch
Display page
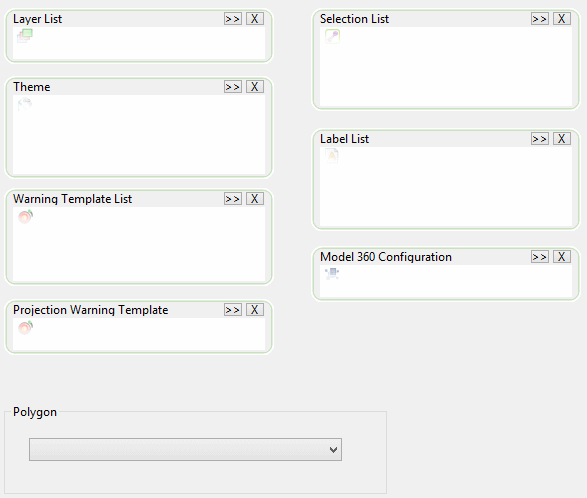
This page is used to set the themes, layers and labels to be displayed when viewing the network model region in IWLive Pro.
| Item | Description |
|---|---|
| Layer List |
Load the layer list to be displayed by default when viewing simulation results in IWLive Pro. The layers present in the selected layer list will always be loaded by default. Additional layers can be added via the Layer control context menu option of the GeoPlan window (available in both InfoWorks WS Pro and IWLive Pro). |
| Theme |
Load the theme(s) to be displayed by default when viewing simulation results in IWLive Pro. The default warning theme that will be applied to network objects in IWLive Pro is set in IWLive Pro. |
| Warning Template List |
Load the warning template(s) to be displayed by default when viewing simulation results in IWLive Pro. When creating incident runs and response runs in IWLive Pro, the user will be able to choose from the warning templates specified in this list. |
| Projection Warning Template | Load one warning template into this box. This is the warning template that will be used for IWLive Pro projection runs. |
| Polygon | This is used to specify a bounding polygon for the baseline, or an area within the baseline that is defined by a polygon outline (sub network polygon). All polygons present in the default model network will be listed. Select a sub network polygon to be used as the bounding polygon, or select the Default option to automatically generate a bounding polygon from network extents. If you want to divide the network into smaller areas or zones that will be easier to manage in IWLive Pro, select the sub network polygon defining the area of interest. This polygon will have to be assigned to a polygon id on the Zones page so that it will act as a zone in IWLive Pro. |
| Selection List | You can optionally load one or more selection lists into this box. These selection lists will be available to pick from in IWLive Pro for bulk export of simulation results. Export settings are implemented in the Export Style database object. |
| Label List | You can load one or more label lists into this box. These label lists will be available for selection in IWLive Pro for loading onto the Map view. |
Zones page
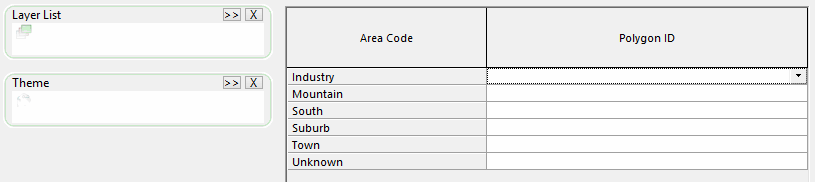
The Zones page is used to configure a theme and layer to be displayed when viewing zones in IWLive Pro. Zones are user-defined polygons that can be used to divide networks into smaller more manageable areas, usually based on hydraulic boundaries. By associating each polygon to one of the listed area codes, users make these polygons act as zones, and therefore define different zones of operation.
| Item | Description | ||||||
|---|---|---|---|---|---|---|---|
| Layer List | Set up zone display options in IWLive Pro by dragging a layer list from the Model Group window and dropping it into this box. | ||||||
| Theme | Set up zone display options in IWLive Pro by dragging a warning theme from the Model Group window and dropping it into this box. | ||||||
| Area Code / Polygon ID grid |
|
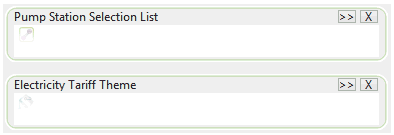
Pumps page
This page is used to configure the Pump Results window of the IWLive Pro Operator program. The Pump Results window displays an overview of the on/off state as well as the electricity tariff for a selection of pump stations.
If no pump station selection list and no theme are selected on this page, the overview displayed in IWLive Pro will encompass all the pump stations in the network. Moreover, if no electricity tariff theme is being applied, the results will be displayed in IWLive Pro using thick green bands for pump stations that are on and narrow red bands for pump stations that are off. See the IWLive Pro Help for more information.
| Item | Description |
|---|---|
| Pump Station Selection List | Load a selection list containing the required pump stations. |
| Electricity Tariff Theme | Load an electricity tariff theme. |
Triggers page
- An alarm raised (alarm ON) whenever a certain value goes below or above a certain level.
- Projection runs automatically triggered at a frequency defined by the user.
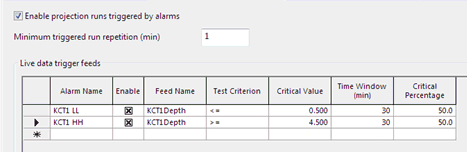
|
Item |
Description |
||||||||||||||
|---|---|---|---|---|---|---|---|---|---|---|---|---|---|---|---|
|
Enable projection runs triggered by alarms |
When checked, enables triggering of projection runs in IWLive Pro. This option is unchecked by default. |
||||||||||||||
|
Minimum triggered run repetition (min) |
Indicates how often the triggered runs will be performed if the alarm condition stays true. IMPORTANT: It is highly recommended to set this value to be less than the value entered for the Run Every field of the Default Model page, which relates to scheduled runs. |
||||||||||||||
|
Live data trigger feeds |
These parameters are used to configure alarms that will trigger projection runs in IWLive Pro.
|
Water Quality page
This page is used to specify one or more solute data objects for water quality simulations.
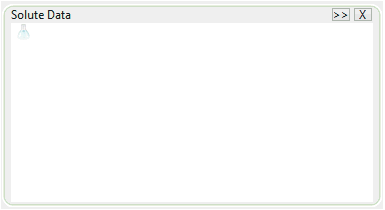
The solute data objects specified in this page can be used when creating new water quality incident or response runs in IWLive Pro Operator. IWLive Pro projection runs use the solute data from the default simulation (simulation specified on the Schedule page of the baseline property sheet). If the base simulation has a solute object then that will always be available and will be used in projection runs. This allows alternatives to be offered when the user creates incident or response runs.
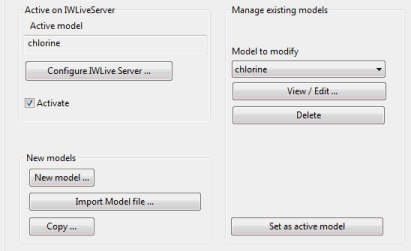
Watch Configuration page
This page is used to create, manage and run PressureWatch / QualWatch models. PressureWatch and QualWatch are real-time water network monitoring and anomaly detection modules. See PressureWatch and QualWatch for more information.
| Item | Description |
|---|---|
|
Active on IWLive Pro Server |
Active model - Defines the model that will be run by the IWLive Pro Server. Configure IWLive Pro Server - Click this button to display the PressureWatch / QualWatch Server Configuration dialog where settings can be entered for the running of PressureWatch / QualWatch models. Activate - Always available Enable this option to activate the active model. This means that if the IWLive Pro Server is running, it will also run the PressureWatch / QualWatch model and generate PressureWatch / QualWatch forecasts and write them into the export database. Note: The
IWLive Pro server only runs the active model. In other words, only one PressureWatch / QualWatch model can be run for a single baseline.
|
|
New models |
New model - Click this button to create a new PressureWatch / QualWatch model. This displays the PressureWatch / QualWatch Model dialog where the new model can be configured. Import Model file - Click this button to display a standard File Open dialog. Select a PressureWatch / QualWatch file (.job extension) and click Open. Copy - Copy the model currently selected in the Model to modify dropdown list. Selecting this option will open the PressureWatch / QualWatch Model dialog of the copied model. Edit as required. |
|
Manage existing models |
Model to modify - Contains the available PressureWatch / QualWatch models. Select a model. View / Edit - Always available Click this button to display the PressureWatch / QualWatch Model dialog for the model currently selected in the Model to modify drop down list. Delete - Delete the model currently selected in the Model to modify drop-down list. Note: The Delete button should be used with care as deletion is immediate.
Set as active model - Click this button to set the currently selected model as active model. The model will appear in the Active model box. |