
An additional log file is created during simulation: file_name_recoater.txt.
Below are the results seen in file 07_mechanical1_recoater.txt:
time (s), layer group, recoater clearance (%), top z deformed coord (mm), recoater coord (mm),
top z undeformed coord (mm)
1.172554E+04            1        77.742                 4.008903E+00   4.040000E+00    4.000000E+00
2.389416E+04            2        58.549                 8.016581E+00   8.040000E+00    8.000000E+00
3.607386E+04            3        47.107                 1.202116E+01   1.204000E+01    1.200000E+01
4.815440E+04            4        70.059                 1.601198E+01   1.604000E+01    1.600000E+01
6.195965E+04            5        64.166                 2.001433E+01   2.004000E+01    2.000000E+01
7.656102E+04            6        59.579                 2.401617E+01   2.404000E+01    2.400000E+01
9.112844E+04            7        59.302                 2.801628E+01   2.804000E+01    2.800000E+01
1.035748E+05            8        78.580                 3.200857E+01   3.204000E+01    3.200000E+01
1.092742E+05            9        79.286                 3.600829E+01   3.604000E+01    3.600000E+01
And here are the results from the 07_mechanical1_recoater.txt file:
time (s), layer group, recoater clearance (%), top z deformed coord (mm), recoater coord (mm),
top z undeformed coord (mm)
1.172554E+04            1             77.742            4.008903E+00   4.040000E+00   4.000000E+00
2.389416E+04            2             58.725            8.016510E+00   8.040000E+00   8.000000E+00
3.607386E+04            3             47.560            1.202098E+01   1.204000E+01   1.200000E+01
4.815440E+04            4             69.893            1.601204E+01   1.604000E+01   1.600000E+01
6.195965E+04            5              0.675            2.003973E+01   2.004000E+01   2.000000E+01
7.656102E+04            6            -22.528            2.404901E+01   2.404000E+01   2.400000E+01
9.112844E+04            7             11.342            2.803546E+01   2.804000E+01   2.800000E+01
1.035748E+05            8             77.417            3.200903E+01   3.204000E+01   3.200000E+01
1.092742E+05            9             78.456            3.600862E+01   3.604000E+01   3.600000E+01
Note that when support structure failure is taken into account, the likelihood of a catastrophic recoater interference event becomes very high.
Another feature that enhances the user’s ability to investigate support structure failure is the Structure Type output, which can be viewed in post processing software. This result assigns an integer value to each element, indicating what kind of structure the element is. Values ranging from 0 to 5 are as follows:
0 – Build plate
1 – Powder
2 – Component
3 – Homogenized component
4 – Support structure
5 – Failed support structure
Figure 2 shows the results for cases 07_mechanical1 and 07_mechanical2 at the 3rd to last increment, while the part and supports are still attached to the build plate. The results have been warped by displacements that are magnified 5x to better show the effect of failed elements.
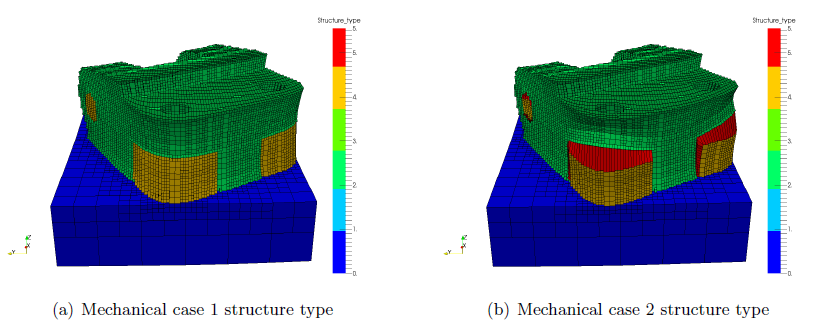
Figure 2: Structure type results
For case 07_mechanical1, seen in Figure 2 (a), elements only have values 0–4, and all support structures are coded as type 4, unfailed supports. This is as expected, as this analysis does not have the support structure card *UTSR enabled. For case 07_mechanical2, shown in Figure 2 (b), there are numerous failed supports, as indicated in the simulation log. Note how the failed elements are stretched. This occurs because the failed elements no longer have any strength to resist deformation.
Now examine and compare the displacement results from the two mechanical cases. Figure 3 depicts the distortion of the two cases while the supports and component are attached to the build plate, again warped by a 5x magnification factor.
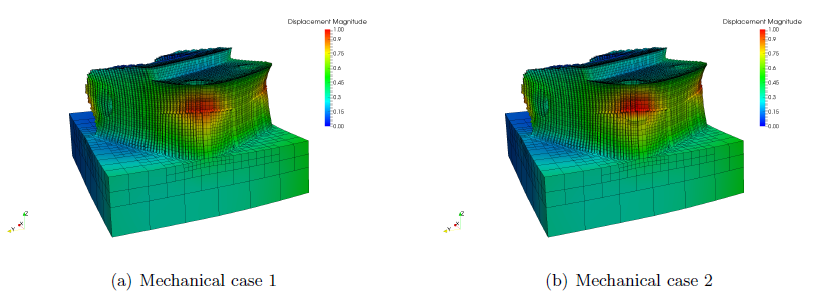
Figure 3: Distortion (mm) with 10X magnification
Figures 3 (a) and (b) show the computed final distortion from the support structure failure analysis using *UTSR (07_mechanical2.in) after the part is removed from the build plate, and after the support material has been removed. Note the increase of distortion and elongation of failed elements. This phenomenon is shown more clearly in Figure 3 (b).
Support structure failure and the resulting displacement can be mitigated by increasing the density of the support structure, changing the orientation of parts to avoid or reduce overhangs, or changes to the build geometry itself.