
Advanced Debugging
Use the Script Debugger to debug your script using single-stepping, breaking (current state and specified breakpoint), and other advanced debugging features.
Test and Debug the Script
Open the script in the Script Editor.
Example CAPASpawnCR automatically creates an associated Change Request at the end of an approved CAPA workflow.
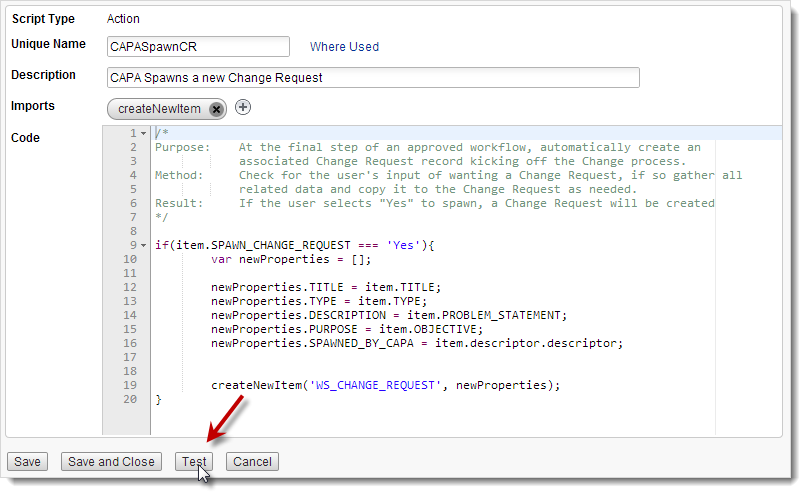
At the bottom of the editor, click Test.
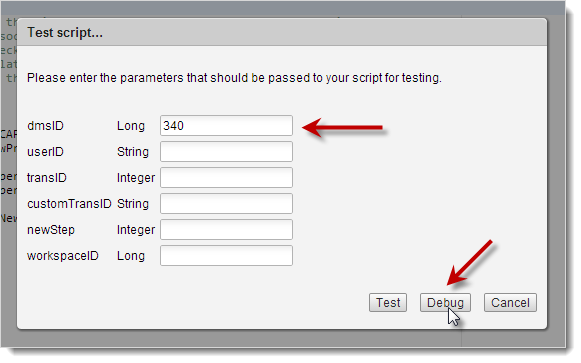
In the Test script popup, enter the parameters that need to be passed to test the script and then click Debug to run the Script Debugger.
Note: If you leave userID blank, the system automatically passes your User Name. If you leave workspaceID blank, the system automatically passes the ID of dmsID's workspace.
Script Debugger Functions and Elements
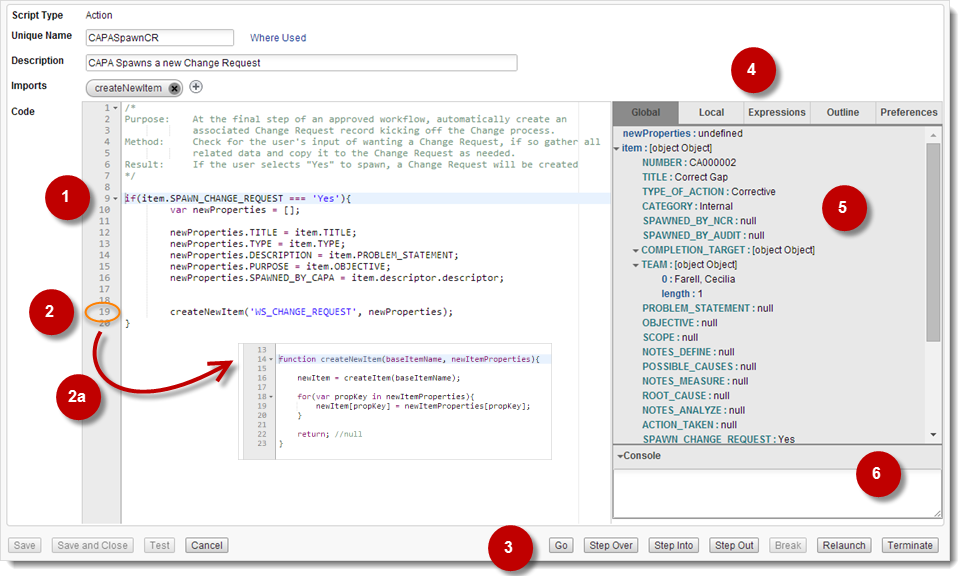
Dynamic highlighting Identifies the current line in the code.
Breakpoints Click code line numbers to have the debugger automatically stop at specific points in the code as it runs the script. To proceed from a Breakpoint, use any of the commands (3). To remove a breakpoint, click the line number again.
Use Breakpoints to inspect and evaluate specific pieces of code, such as functions in imported Library scripts (2a), while bypassing code that has already been inspected. To use Breakpoints in imported Library scripts, see Outline under Inspection Area Tabs (4).
Command Buttons Go - Runs the script from the beginning of from the current line until a Break or a Breakpoint.
Step Over - Executes the current line and goes to the next line (step-by-step debugging).
Step Into - "Goes into" the highlighted function for more detailed, step-by-step debugging (see Step Out). In the case of a function called from an imported script, the debugger steps into the Library script itself so you can inspect it line-by-line (Step Over). To navigate and debug all imported scripts, see Outline under Inspection Area Tabs (4).
Step Out - Gets out of a "stepped-into" function.
Break - Stops the script so you can inspect and evaluate code at the current state in the debug thread. To proceed from a Break, use any of the commands (3). The button is available only when a debug thread is running.
Relaunch - Stops the current debugging thread and starts a new one using the same parameters.
Terminate - Stops the current debugging thread and exits the debugger. Use this command if you want to debug the same script but with different parameters. To debug a different script, exit the Script Editor.
Inspection Area Tabs
Global - Displays the tree of global variable values. The last changed or created variables are highlighted in grey (see 5).
Local - Displays the tree of local variable values when using Step Into and Step Over on other scopes, such as stepping into functions from imported Library scripts and previewing local variables.
Expressions - Used to enter expressions that you want to evaluate based on the current variables. Click Refresh to return and automatically update results during the next debug.
Outline - Used to navigate and view all imported Library scripts and their functions. Breakpoints can be set in each code scope.
Preferences - Used to specify Break settings (Break on exceptions is the default), and UI theme and font size.
Inspection Data Tables
While in Global mode, you can expand and collapse the tree of global variable values to inspect data tables during debug. The last changed or created variables are highlighted in grey.
Console
Displays debug output when using
print()andprintln()in scripts. You can show or hide the Console as needed.