
View a Chart
When a report is run as a chart, it is displayed in an interactive popup window.
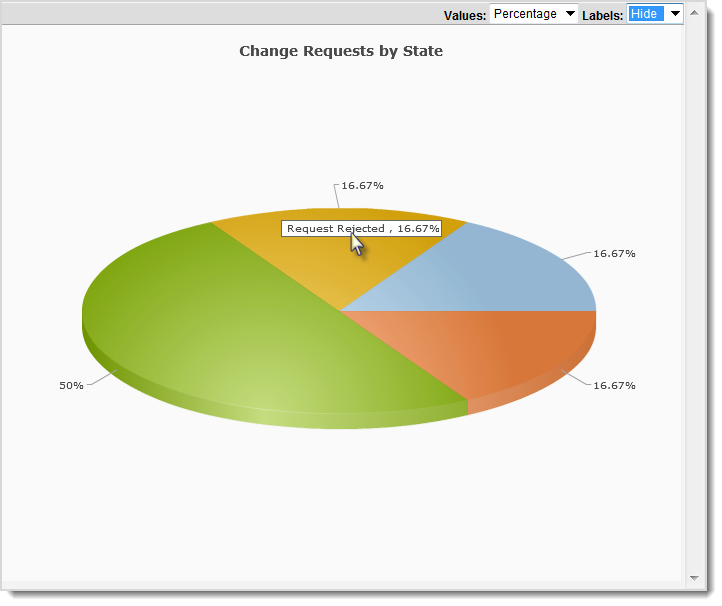
Display Report Values
- In the Values drop-down list, select how the values are displayed for the type of chart.
Show or Hide Report Labels
- In the Labels drop-down list, click Show or Hide.
Display a Data Info >Tip
- Place the cursor over the chart element for which you want to see data.
Print a Chart
- Right-click the chart and then select Print.
Save a Chart
- Right-click the chart and then select a format for the chart:
- JPEG
- PNG