Data Tracing:
The Data Tracing feature provides a real-time visualization of how data flows through pipeline plugins. It shows animated traces of data movement, highlights errors, and provides detailed logs. This helps users quickly understand pipeline behavior and troubleshoot issues.
Enable Data Tracing
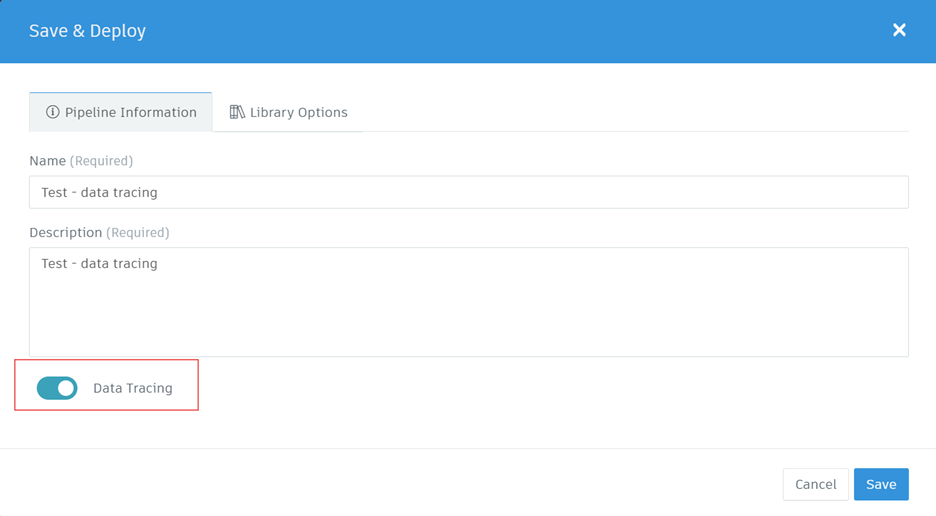
Build and prepare the pipeline for deployment.
In the Save and Deploy window, toggle Data Tracing on.
- The Platform Console will display a confirmation message:
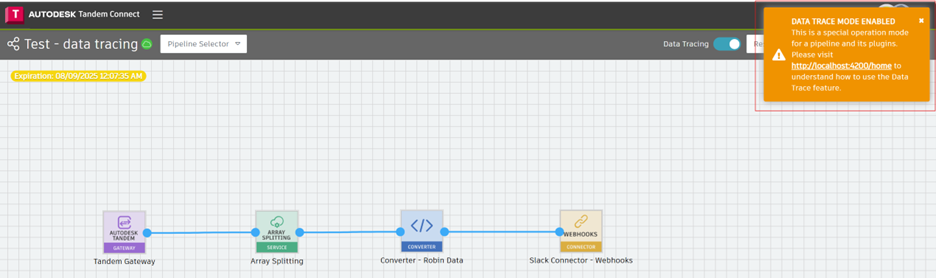
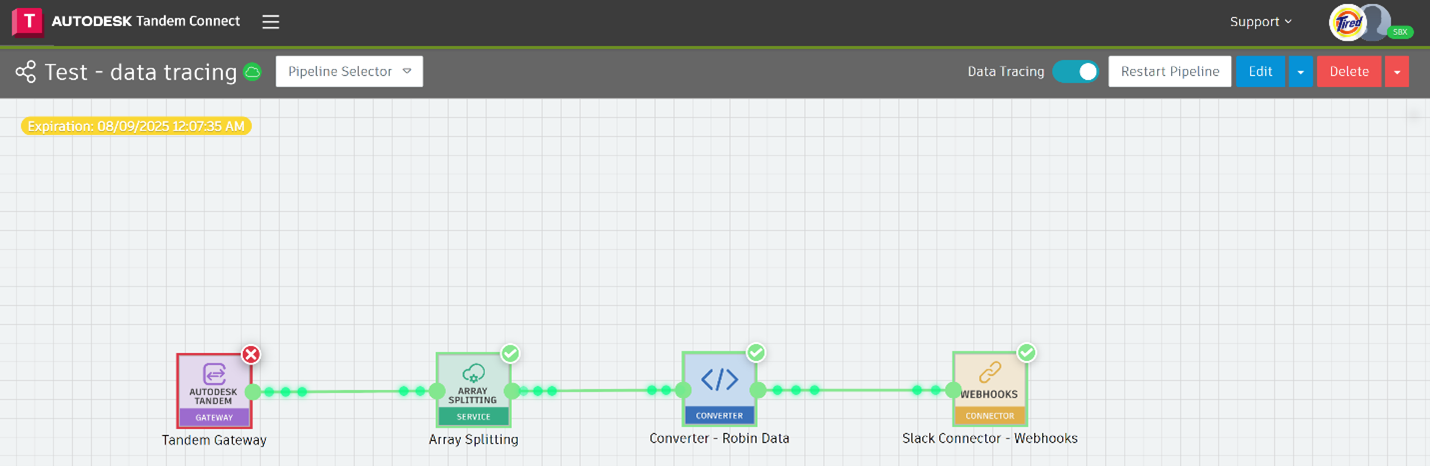
Visualizing Data Flow
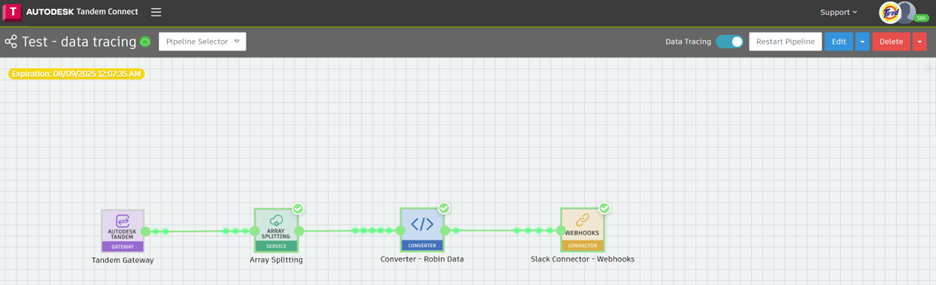
Once the pipeline starts receiving data logs, traces will be displayed:
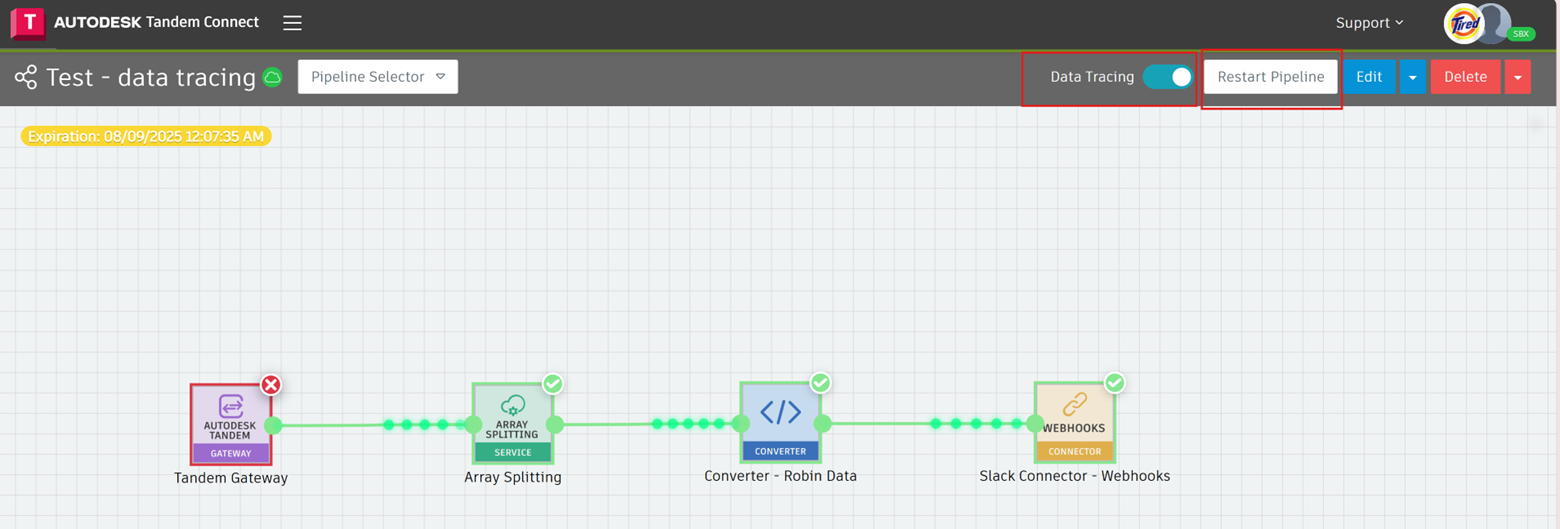
• Green highlights → Successful execution and data flow.
• Red highlights → An exception or error in the plugin (e.g., in the Tandem Gateway plugin).
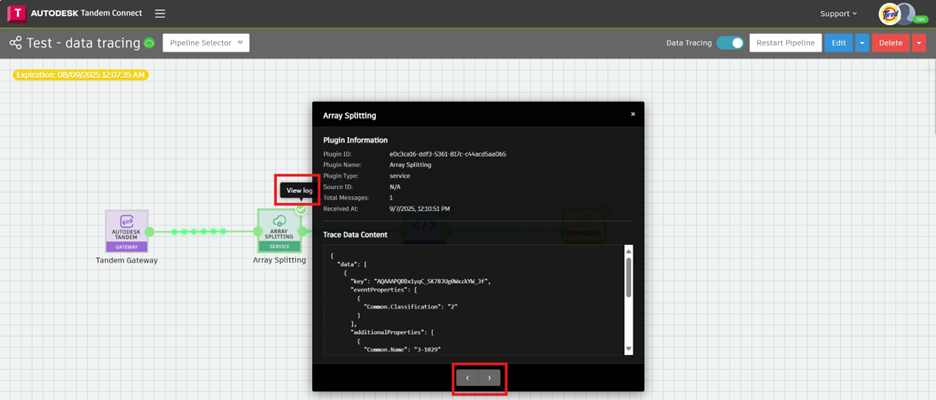
Viewing Logs
Double-click the Log button on a plugin to open its logs.
Use the arrow buttons to navigate between logs of different plugins.
Please Note:
• Only one message or data log from stream/gateway can be traced at a time.
• To restart a Trace or view next message, User must restart the pipeline.
• If Data Trace feature is turned on, the pipeline will process only one message per restart. To disable tracing, toggle the Data Tracing switch off in the console