Work with the Gantt chart
A Gantt chart is a visual representation of your project schedule. Use it to plan your project management activities and quickly make adjustments to your timeline.
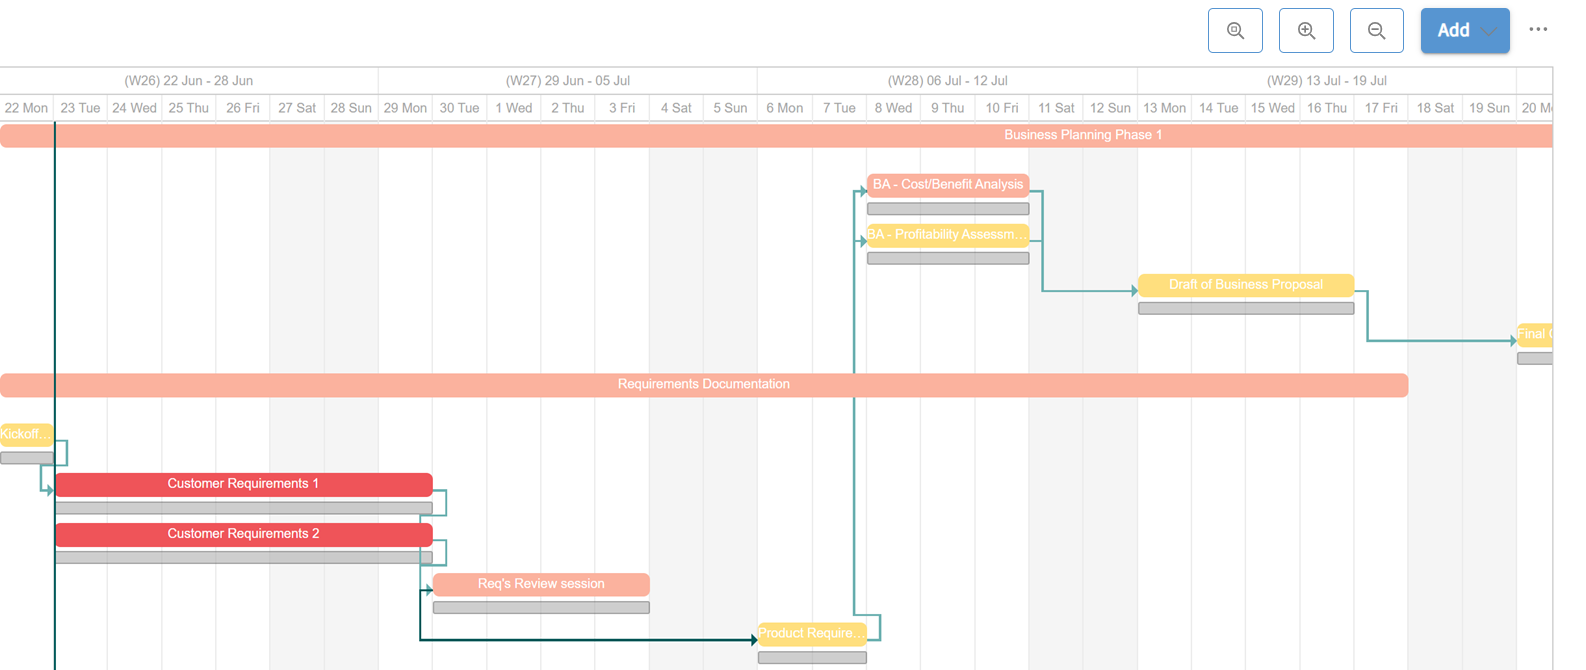
You can view your project's Gantt chart on the center/right side of the project management interface. Your tasks and stage gates are represented by colored bars, which extend from the activity's start to end dates. Your milestones are represented by yellow diamonds, which mark the day the milestone occurred.
Baselines (planned and actual times)
Baselines are helpful for comparing your original timeline projections with the actual timeline of the project. This makes it easy to determine which tasks were performed on time or ahead of schedule and which ones were delayed.
In the Gantt chart, the Actual Time for a task is indicated by the colored task bar, while the Planned Time is indicated by a gray bar just below the colored bar. The Actual Time colored bar will be updated and moved within the Gantt chart depending on when the task workflow was actually started and completed. Once a task is created, the gray bar indicating the Planned Time will not change, unless the task creator edits the constraint set for the task.
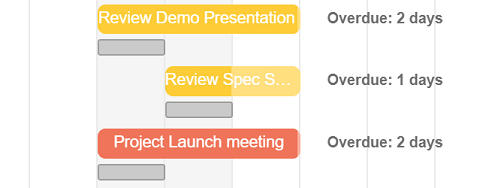
In the example image below, we can see three distinct tasks that started on time but were not completed on time. In these cases, the Actual Time (represented by the colored bar) has extended past the end date of the Planned Time (gray bar), to indicate that the time spent on this task has exceeded the original plan:
Be careful when modifying the length of projects that are in a Draft state. When you do this, the Actual Time (colored bar) of the project and the Planned Time (gray bar) are changed in unison.

Once a project is in progress, the Planned Time (gray bar) remains static and is unaffected when changing the Actual Time.
View the critical path
The critical path represents all the activities that, if delayed, affect the completion time of the entire project. Activities that are not on the critical path can be delayed without delaying the project.
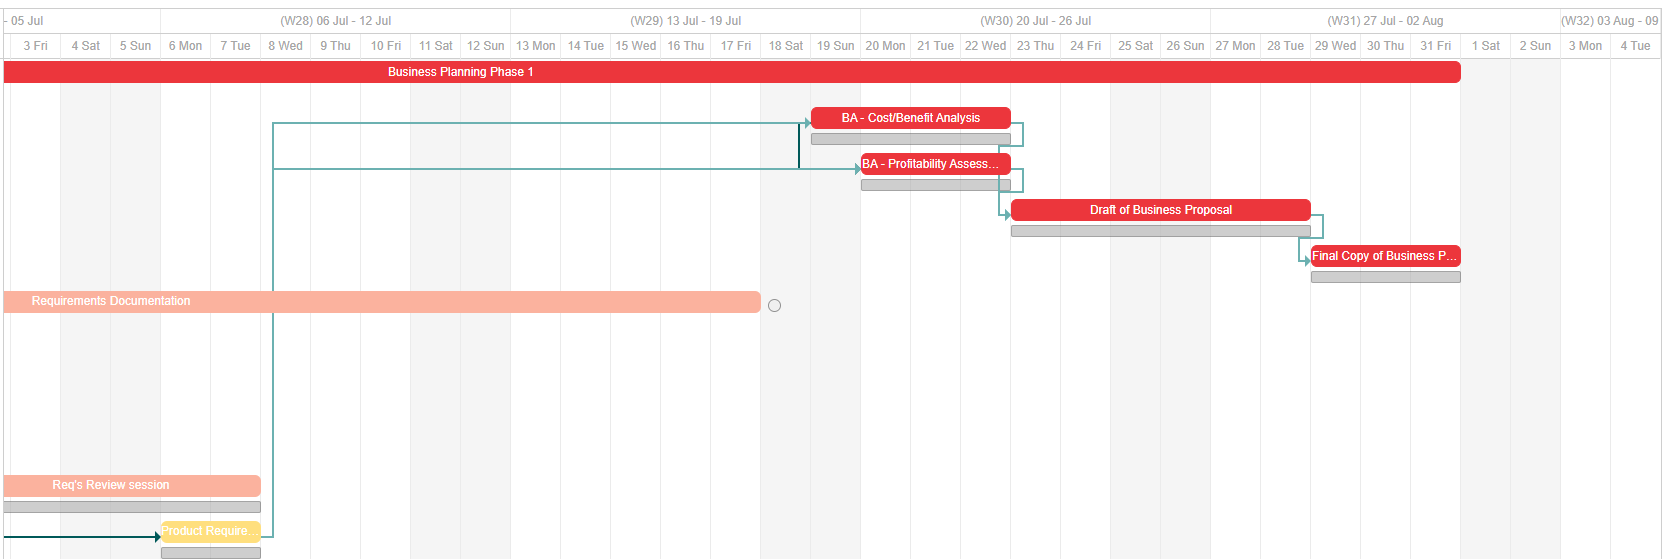
To display your project's critical path, click the global actions icon (![]() ) in the top-right corner of the activities interface and select Show critical path. The critical path will be displayed in red. In our example above, you can see all the dependent activities, as well as the stage gate, that if delayed, would delay the overall project.
) in the top-right corner of the activities interface and select Show critical path. The critical path will be displayed in red. In our example above, you can see all the dependent activities, as well as the stage gate, that if delayed, would delay the overall project.
View slack
Slack represents the amount by which activities can be delayed before becoming part of the critical path.
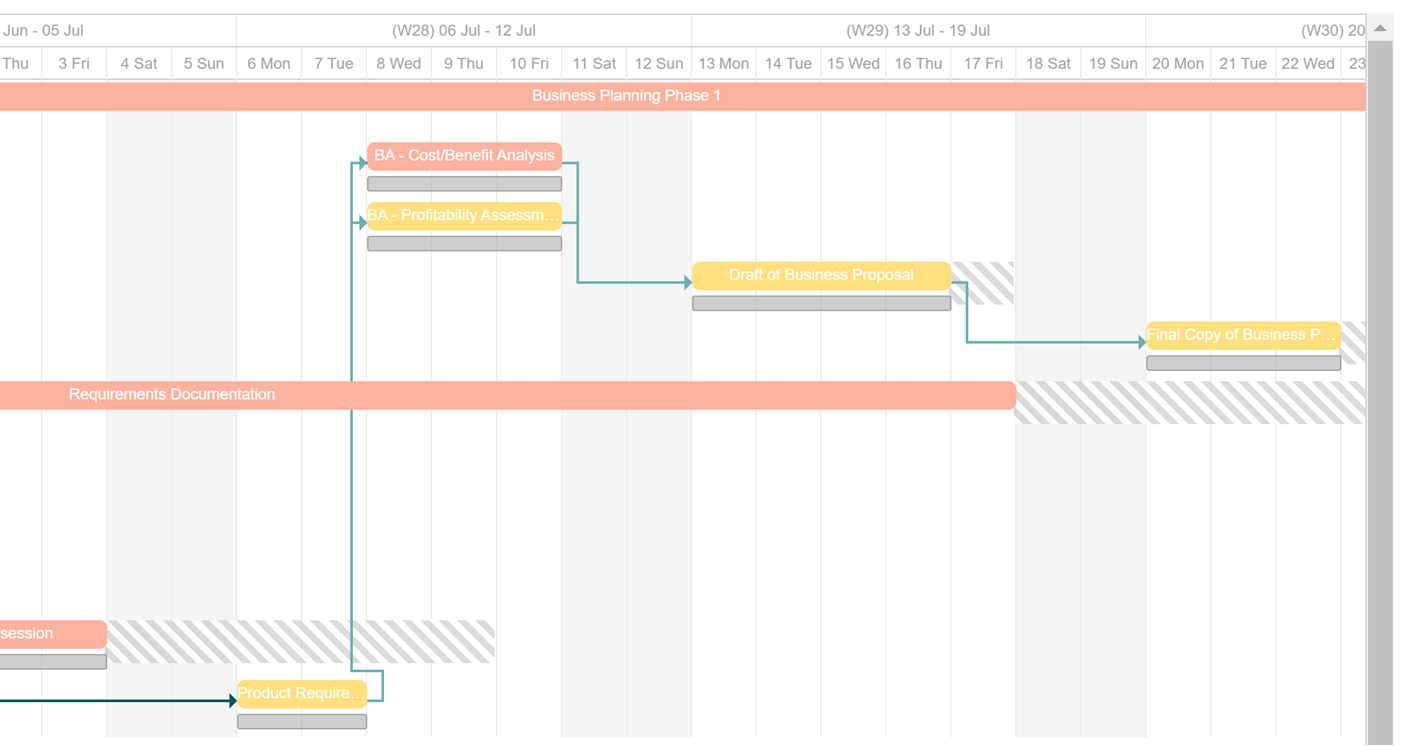
To display your project's slack, click the global actions icon (![]() ) in the top-right corner of the activities interface and select Show slack. Slack will be displayed with diagonal grey bars.
) in the top-right corner of the activities interface and select Show slack. Slack will be displayed with diagonal grey bars.
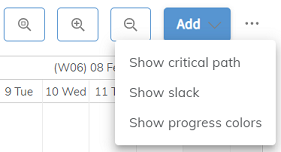
Show progress colors
The show progress colors option will toggle on/off activity status colors for each row within the Gantt chart. The row of activity will be given the following color based on its lifecycle:
- Red - Activity has not been started yet (draft state).
- White - Activity is in progress.
- Green - Activity has been completed.
Edit activities in the Gantt chart
Upchain's Gantt chart enables you to make quick changes to your activities without having to open their detailed views.
Change an activity's start date
To change an activity's start date, click the activity within the Gantt chart and drag it to the new start date.
Change an activity's duration
To change an activity's duration, hover your cursor near the start or end of your activity, until it becomes an arrow, then click and drag it to the desired duration.
Add a dependency
Dependency lines represent logical relationships between your activities. When the start or end date of a task changes, the dates of dependent tasks will automatically update to reflect the change. Dependencies may be created by the project creator only.
Upchain supports the following dependency types:
- Finish to Start - The predecessor ends before the successor can begin.
- Start to Start - The predecessor begins before the successor can begin.
- Finish to Finish - The predecessor ends before the successor can end.
- Start to Finish - The predecessor begins before the successor can end.
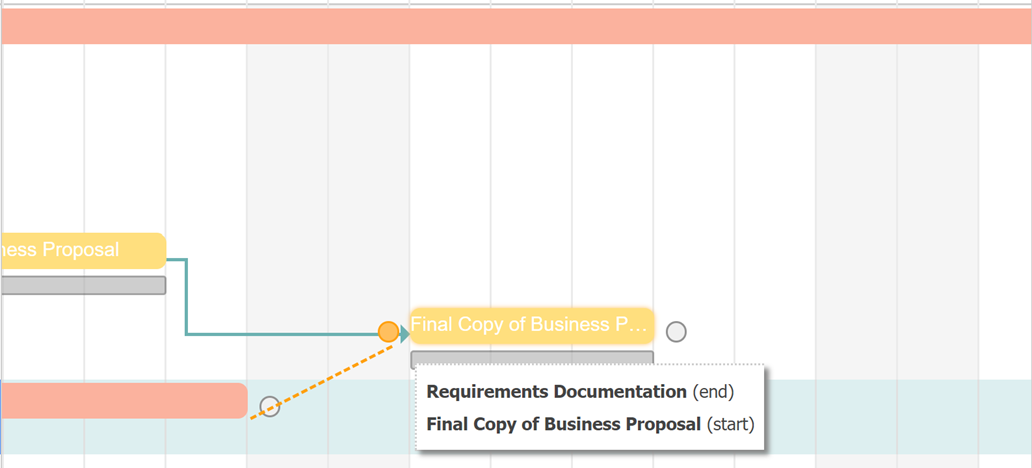
To add a dependency, hover your cursor over the predecessor activity, then click the circular icon at the start or end, and drag the arrow to the successor activity.
Delete a dependency
To delete a dependency, hover your cursor over the dependency line and click it, then click Delete. Only the project creator may delete dependencies. Deleting cannot be undone.
