The Results environment serves two purposes:
- To visually check the FEA model before running an analysis. By displaying elements, nodes, properties, loads, and so on, the user can confirm that the model accurately reflects the needs. Use Analysis
 Analysis Check Model in the FEA Editor environment to check the model into the Results environment.
 - To show the results visually after running an analysis. The Results environment will show all the results available for the analysis type performed. You will also use the Results environment to create figures of the results and animations to be added to reports and for presentations.
- The date and time when the model was last Checked and last analyzed are stored. If a change is made to the model that would affect the results, such as changing the mesh, material properties, Element Definition, analysis parameters, loads, or constraints; then the Checked date is updated. When the Checked date is newer than the analyzed date, the following message is given whenever you try to display the model in the Results environment:
The results are out-of-date as the model has changed.
Do you wish to see the old results anyway?
If the model has truly changed, the old results should not be used.
- If the model has been changed, or if a different version of the software is being used (which could result in different node or element numbering), it is possible that the existing results will not match the current FEA model. If you proceed to use the existing results, check the validity of the results carefully. Alternatively, re-analyze the model to be certain that the results are for the current model. Changes to the model include any geometry changes which can either be deliberate (for example, deleting lines and redrawing them) or transparent (for example, transferring to PV/Designer).
- This message will appear when doing a restart analysis for those analysis types that show the results while the analysis is running. This behavior is expected.
Understand the Results
Depending on the analysis type, there may be two distinct types of results that can be displayed. It is wise to understand the difference between these.
- Nodal results: A nodal result is a type of result that is calculated only for the nodes (a position in space). Thus, each node has only one value associated with it. Examples of nodal results include displacements in a stress analysis and temperatures in a heat transfer analysis. Nodal results are not smoothed since there is only one value. (See the paragraph Smoothing Results below.)
- Element results: An element result is a type of result that is calculated for each node in each element. Therefore, each node has multiple results associated with it: one value from each element connected to the node. Stresses are an example of element results. The deflection in the element is used to calculate the stress at each node. Because adjacent elements have different deflections, adjacent elements can have different stress results at the same node
- Smoothing Results: In a continuous material, the stresses change in a smooth pattern. But the FEA approach and the element results described above give discontinuous results; the degree of discontinuity depends on the mesh refinement. Thus, the default display method for element results is to show the smoothed or average value. The smoothed result is just the arithmetic mean of the results from all the elements attached to the node, and this smoothing is likely to be closer to the real value than the individual results. However, different parts may be made from different materials. Or, in the case of a model constructed from plate elements, different parts may be different thickness. In these situations, the results are theoretically different in each part at the common node. The result is not continuous. So the default smoothing option is to not smooth the results across different parts. Note: Some element results should not be smoothed, even within one part. For example, the Heat Rate of Face in a heat transfer analysis shows the amount of heat passing through each face. In an ideal model, the heat leaving one face equals the heat entering the adjacent face. So these results would be equal but opposite in sign, so displaying the smoothed result would show a heat rate of 0. For this type of situation, the smoothing should be deactivated.
The results of the analysis can be obtained either visually, by graphing, or by inquiring. There are some subtle differences between them.
- Visual results: Visual results are results shown in the display area. These include the values shown in the legend box, by the maximum value and minimum value in the annotation, by the maximum and minimum result probes, and by the values shown by probes. The visual results are based on the elements that are not hidden. Thus, hiding elements can change the numerical values and color contours that are presented visually. If you right-click a part in the browser (tree view) and uncheck Visibility, all of the elements comprising that part are hidden.
In addition, the results displayed on a part can be hidden by right-clicking on the part in the browser and unchecking Visibility of Results. This removes the result contour and displays the part with its color, which is the same as the part color shown in the FEA Editor environment. Because the elements are still visible, the values shown in the legend, annotation, and probes are not affected by the Visibility of Results option. Similarly, turning off the Visibility of Face or Visibility of Mesh options for either parts or surfaces does not hide the elements nor affect the displayed numerical results.
- Inquiring on results: On the other hand, when nodes are selected and Results Contours Inquire Current Results is used, the Inquire: Results window optionally shows the results of all elements connected to the selected node, regardless of whether the elements are hidden or not, regardless of whether the complete mesh is active or not. (Naturally, the result in the Inquire: Results window follows the smoothing options.)
- Graphing results: Results that are graphed (plotted) follow the same rules as the visual results.
When the model includes parts made from solid elements (solid element types include brick, 3D, and tetrahedral elements), the values shown visually are by default based on all the nodes that form the elements on the surface of the model. An element is considered to be on the surface if any of its nodes are on the surface. (Be aware that a surface may be on the inside of the model, such as the surface of an interior cavity.) So technically a maximum or minimum value shown in the legend may be at a node one element underneath the surface. In this case, it can be hard if not impossible to see the color on the model that represents the maximum or minimum value. If some elements are selected and hidden, a new set of surface elements is created, and the results shown are based on the new set of nodes attached to the surface elements.
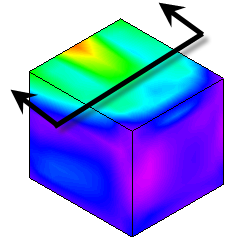
For stress models, viewing the results from the surface only is acceptable since the maximum stress is generally on the outside surface of the model. If the maximum expected stress is inside the model, such as a Hertz contact stress or thermal stress, then a slice plane or hiding elements would be used to show the inside, so the nodes on the new surface are used for all the results. For other analysis types, the maximum result may be in the interior of the solid mesh. For these situations, use Results Options View Show Internal Mesh. When this item is active, all the solid elements are used when displaying the results. See Figure 1.
|
|
| Default view of a solid cube modeled with brick elements. Results Options View Show Internal Mesh is off. |
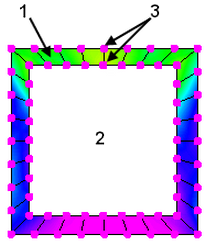
If the model were sliced, you would see that only the elements on the surface are shown (1). The results on the interior elements (2) are not shown by default. The results shown visually in the display area are based on the nodes attached to the surface elements (3). |
|
Figure 1: Results with Solid Elements |
|
Physically slicing the model in the Results environment exposes a new layer of surface elements, just like the example of hiding elements mentioned above. The slice in Figure 1 is a theoretical discussion.
See also the following sections of the documentation for additional information on these topics:
| Results Options | to activate or deactivate the smoothing of the element results |
| Smoothing Options | to set the options used with the smoothing calculation, such as the smoothing function (mean by default, other options such as maximum, minimum, range) and smoothing across part boundaries. |
| Plot Settings Dialog | to change the display of the color contour and all things associated with the legend box. |
| Probe | to display the result at a node as the mouse pauses on it. |
| Results | to obtain the results of selected nodes in a text window, with options to sum the results and save them to a file. |
| Show Internal Mesh | to activate or deactivate the display of the interior solid elements. |
| Graphing the Results of an Analysis | to graph the results of a single node or multiple nodes, and manipulate the results (derivative, integrate, and so on). |
Selection, Visible Items, and Hidden Elements
Elements and nodes can be selected by these methods:
- In the display area. Only items that are not hidden can be selected by clicking (Selection Shape Point or Rectangle) or dragging a rectangle to enclose the items to select (Selection Shape Rectangle). Hidden elements or nodes on hidden elements cannot be selected. Although the results may not be shown on the interior elements ( Results Options View Show Internal Mesh is off), the elements are not hidden. So, the nodes and elements on the interior of a solid mesh can be selected (such as by dragging a rectangle).
- In the Inquire window. Each Inquire window (Results Inquire Inquire Element Information) includes a Specify button which prompts the user for a node number or part and element number. When using the Specify button, hidden items can be selected.