ICMLive Operator Client provides a number of spreadsheet style grid windows listing objects in the network.
Each column in the grid contains data for a particular field or result, with each row in the grid listing the values for a single object.
The grid windows do not always show all the data for an object. For example, tabular data about an object cannot be displayed. To view all data for an object use the appropriate Object Properties Window.
The grid windows in ICMLive Operator Client are divided into the following sets:
| Window | Access |
|---|---|
| Summary Window |
Overview Page - Summary option of the Window menu. |
| Node Results Window |
Network Page- Node results window option of the Results menu. |
| Link Results Window |
Network Page - Link results window option of the Results menu. |
| Subcatchment Results Window |
Network Page - Subcatchment results window option of the Results menu. |
| Summary Results Window |
Network Page - Summary results window option of the Results menu. |
| Alerts Window |
Network Page - Alerts option of the Window menu. Note: The
Alerts Window is slightly different from the other grid windows as it relates to alerts and not network objects. However it is mentioned in this topic as it is a grid window.
|
Opening network object / Results grid windows
To display a grid window, click on the tab with its name on the Network page (or the Overview page) or select the option with its name from the Window or the Results menu.
A tick ( ) in front of a window name in the
Window dropdown menu indicates that the window is open in
ICMLive Operator Client.

Example of Grid Window
Displaying field properties
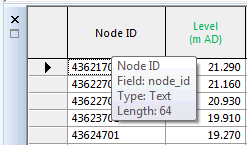
Hover over a column header with the cursor to display a tooltip showing the following information about the related object data field:
- Field name
- Database field name
- Data type
- Size / Length
- Precision (if not null)

Displaying property sheets
Display the Object Properties Window for a particular network object simply by double clicking to the left of the row for that object.
Alternatively, right click on the row and select Properties from the popup menu.
Customising grid layout and appearance
A number of options change the layout and appearance of the grid. Some layout changes can be saved, (for example column ordering), and used as the default layout when the grid type is opened in the future.
|
Adjust column width |
The cursor will change as shown when correctly positioned over the column divider. |
|
Change column order |
The picture shows a valid drop position for the selected
DS Node ID column. If the position where you want to drop is invalid the
|
|
Freeze columns |
Columns can be frozen at the left hand side of the grid so that they are visible at all times. Select one or more columns and choose Freeze columns from the context menu. The columns are moved to the left hand side of the grid. The boundary between frozen and scrollable columns is marked with an extra thick line. When you scroll the grid sideways, the frozen columns do not move. To unfreeze all frozen columns, choose Unfreeze all columns from the context menu. |
Restoring the default layout
It is possible to restore the original default layout for all the grids at once by selecting Reset toolbars and windows from the Tools menu. The size and position of dockable windows (and toolbars) will be reset to the ICMLive Operator Client default settings. The changes take effect from the next time the application is restarted.
Autofiltering grid data
Data can be autofiltered in network grid window columns, allowing the display of rows of data based on the content of cells and conditions applied to them.
See the Filtering Grid Data topic for more information on how to autofilter column data in grid windows.
 To adjust the width of a column, drag the divider line on the right of the column header.
 To change the column order, select a column and drag it to a new position. If the position is valid, the dividing line between columns where the dragged column will be inserted turns red.
 cursor will be displayed.