These windows contains a grid of the alert instances relevant to the simulation currently displayed in the Network page. Both types of window are displayed in the middle of the Network Page beneath the GeoPlan Window.
To display a window, click the Alerts or the Verification Alerts tab in the middle of the Network page, or select Alerts or Verification alerts from the Window menu.

If alert or verification alert generation for the currently displayed simulation has not yet completed, (because the simulation is still running or because the alert generation has failed), the header bar of the window will be coloured red. This allows the user to distinguish between an empty alert instance list due to zero alert instances being generated and an empty list due to alert generation process failure.
To sort the items in the grid, right-click the column to be sorted and select Sort Ascending or Sort Descending from the context menu. To zoom to and highlight the related network object on the GeoPlan window, right-click the object row and select Select and find in geoplan from the context menu. Additionally, data can be autofiltered in the window by the use of the Filter and Filter on current cell value options. See the Autofiltering Grid Data topic for more information.
Window description
| Field | Description |
|---|---|
| Alert Definition ID |
The name of the alert, identifying the type of event occurring in the area of interest, e.g. critical pressure. Alert names are specified in the Alert Definition List set up in InfoWorks ICM Ultimate or ICMLive Configuration Manager. |
|
Target ID |
The object identifier of the network object for which the alert has occurred. If the object does not have an Asset ID, the Object ID will be displayed instead. |
|
Target type |
The type of object that the warning applies to, e.g. node, link. |
| Priority | Priority of the alert, as defined in InfoWorks ICM Ultimate or ICMLive Configuration Manager in the Alert Definition List object. |
|
Category |
Alert category, as defined in InfoWorks ICM Ultimate or ICMLive Configuration Manager in the Alert Definition List object. |
| Onset time |
Simulation time at which the event that triggered the alert first started. |
|
End time |
Simulation time at which the event that triggered the alert stopped. |
| Peak value |
The maximum or minimum peak value for the event that triggered the alert. The peak value is defined in the Alert Definition List object in InfoWorks ICM Ultimate or ICMLive Configuration Manager. This field will be empty if no peak value was set in the Alert Definition List object. |
| Units | The units of measurement for the peak value. This will be the same as the currently selected Unit. |
| Peak time | The time that the peak value was reached. |
| Notes |
Information about the alert that was added in the Alert Definition List object in InfoWorks ICM Ultimate or ICMLive Configuration Manager. If only part of the note is visible, click the field to open the Notes window where the entire note can be viewed. |
Context menu
The two following options are available via a context menu (right-click):
Select and find in geoplan - allows the user to zoom to and highlight the related network object on the GeoPlan.
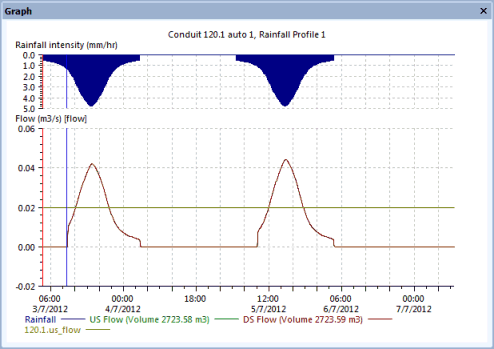
Display graph - displays a graph for the selected alert definition and network object. If an alert has been generated more than once for the same network object (e.g. the same alert appears on more than one row of the Alerts Window for the same network object), the graph will show all the alert occurrences.

Example of graph for an alert definition implemented on the us_flow field of conduits with a threshold of 0.02 m3/s.
As can be seen from the graph, the alert has been generated twice for conduit 120.1, between 12:12 and 20:24 on the 03/07/12 and between 12:00 and 20:32 on the 05/07/12.