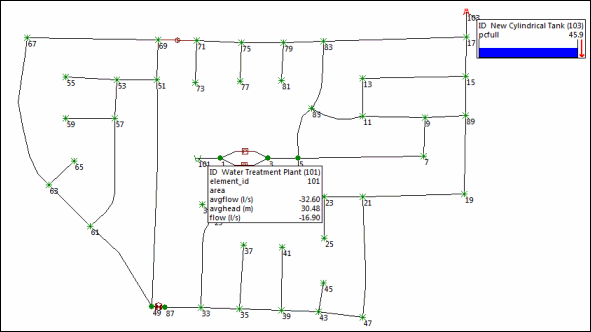
Summary results can be displayed for one or more network objects using labels on the Map view. These labels display constantly changing results as the simulation is replayed. You can also freeze the simulation at a timestep to view snapshot results.
Use the ![]() button on the replay toolbar to move to a specific
timestep or use the step forward
button on the replay toolbar to move to a specific
timestep or use the step forward  and step backward
  buttons to move a timestep at a time for closer inspection
of results values.

Labels showing results for a reservoir and a tank (taken from IWLive Pro (InfoWater)
For full details on using configurable labels on the Map view, see
Displaying
Labels on the Map view. You can add and move configurable labels on the
Map view using the  tool.
tool.
