
In Viewport 2.0, you can visualize metadata assigned to vertices, edges, faces, and vertex faces on polygons.
You can visualize metadata using the Maya menu or marking menu; or via MEL/Python commands.
You can visualize in 3 modes:
- color
The displayed colors range from 0.0 (black) to 1.0 (white). Booleans are displayed in white or black, while integers and floats are displayed grayscale. Vectors (3 integers or 3 floats) are displayed as RGB color.
For a vector of 2 floats/integers, the float/integer values are mapped to the R and G values respectively. The Blue value is set to 0. For a single float/integer value, the same value is mapped to all of RGB. For an array of 4 or more floats/integers, only the first three values are mapped and all other values are ignored.
When visualized, vertices/edges/vertex faces with metadata assigned are displayed larger and thicker than those that are selected but without metadata assigned.
Note: In this mode, you also have the option to remap the color range, or extrapolate the color displayed on the vertices to their surrounding faces. See Extrapolate vertex color to faces when visualizing metadata and Remap the color range when visualizing metadata for more information. - string
The metadata values are displayed as strings above the component.
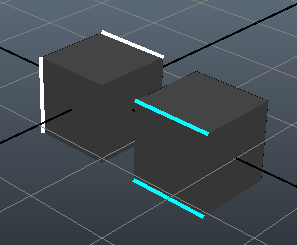
- ray
The metadata values are displayed as a ray emitting from the center of the component. Rays are drawn on top of other display components such as displayed vertices.
For a single float/integer value, a ray is drawn emitting from and perpendicular to the center of the component. By default, the length of the ray represents the metadata value, and the color of the ray is white.
For a vector of 3 floats/integers, the direction of the ray represents the metadata value, and the length of the ray represents the magnitude of the vector. For example, metadata values of (1, 1, 1) and (2, 2, 2) both emit a ray from the component with a direction of (1, 1, 1). However, the ray representing (2, 2, 2) is twice as long as that of (1, 1, 1). For a vector of 3 floats/integers, the color of the ray is dark red.
For a vector of 2 floats/integers, the float/integer values are mapped to the X and Y values respectively while Z is set to 0. For an array of 4 or more floats/integers, only the first three values are mapped and all other values are ignored.
Note: In this mode, you can scale the ray length if the default length that represents the metadata value is too short, or too long. Select Display > Polygons > Metadata > Visualize Metadata > to open the
Metadata Visualization Options window and select
Ray as your visualization method, then adjust the
Ray length scale.
to open the
Metadata Visualization Options window and select
Ray as your visualization method, then adjust the
Ray length scale.
You can visualize the following data types:
- boolean
- integer
- float
- vector
- string
Note: Only string visualization mode can be used for streams of string data type.
Visualization is supported in wireframe, shaded, textured, and Use All Lights modes, and even in Smooth Mesh Preview mode.