
Visualizing your results is an important part of the analysis process as it allows you to assess the quality of your analysis model and to view the physical performance of your design. With a good understanding of device behavior, you can make informed design decisions. Autodesk Inventor Nastran provides a range of tools and options for interacting with results and for controlling result appearance. In this section, we will cover the following tools:
- Results appearance options
- Showing deformation and contour results
- Animating results
Displaying Results
The easiest way to display the most common results quantities is through the Results branch of the Analysis tree. The most commonly used results quantities are automatically added to the branch for you:
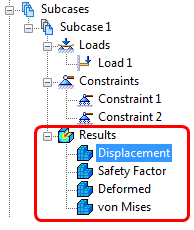
- Displacement: A scalar value showing how much the model changes in response to applied loading.
- Safety Factor: A scalar quantity that shows how much stronger a structure is beyond its applied loading.
- Deformed: Shows how the model changes shape in response to applied loading. Note that the deformed shape of the model is displayed, but no scalar results are shown. See the Deformation section below for additional information.
- von Mises: This is the solid stress, and is best for predicting yield in ductile materials.
To display a quantity, modify how the quantity is displayed, or to animate the deformation, right-click on the branch for a specific result quantity and choose from the available options:
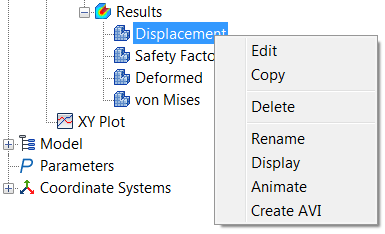
- Edit: Opens the Plot dialog. With this dialog, you have full control of how the result quantity is displayed.
- Copy: Create a new branch for a result by using an existing result as a starting point.
- Delete: Remove the result branch from the Model Tree.
- Rename: Change the name of the result quantity.
- Display: Show the result quantity on the model.
- Animate: Create an animation of the model deformation.
- Create AVI: Capture the animation to a file.
Contour Options
The Plot dialog contains several options for controlling how the results appear on the model. These are useful for isolating results in specific locations and determining the effect of the mesh on the results. With these tools, you can often determine if the mesh is too coarse.
It is a good idea to examine how modifying these options affects the result display on your model:
- Data Conversion (Average, Maximum, Minimum)
- Data Type (Corner or Centroidal)
- Contour Type (Nodal or Elemental). When Elemental is selected, several additional options are available. To create a view in which each element face shows a single value, select Elemental and No Averaging:
You can use the Display Options section on the left side of the Plot dialog to set the type of Rendering. The most commonly used options are Fringe (shown on the left) and Continuous (shown on the right) :
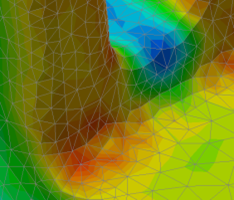
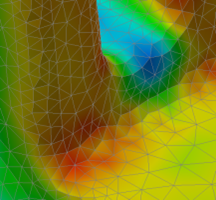
Fringe is best to evaluate convergence.
Contour plots have smooth edges. When they follow the shape of the element edges, there is a good chance that the mesh should be refined in that region.
Deformation
The primary use of the deformation plot is to show how the part or assembly changes shape in response to applied loading. To show deformation, in the Results branch of the tree, right-click .
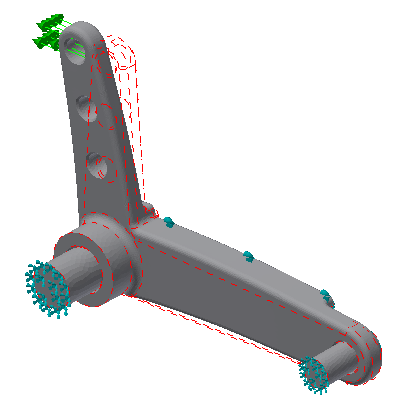
To control the deformation plot, in the Results branch right-click and in the Plot dialog, click the Deform Options tab. Be sure the Vector is set to Displacement and the Type to Total:
- Use the
Deformation Scale to adjust the amount of deformation displayed on the screen.
- Use Percent to ensure that you see displacement, regardless of how small the absolute value is. The default value of 10% ensures that you will see exaggerated deflection in most cases.
- Alternatively, use Actual to see the true physical displacement. A value of 1 displays the true scale. Larger values scale the displacement.
Animation
To animate the displacement, right-click on the result quantity in the Model Tree, and select Animate. To modify the animation settings, right-click on the result quantity, and select Edit.
On the Plot dialog, select the Animation Options tab.
The animation options allow you to control the number of frames in the animation and the delay between frames (which is really the animation speed). You can also control how the animation cycles with the Mode control. These are the available options:
- Half: The animation occurs from the initial state to the maximum deformed state. The cycle restarts back at the initial state.
- Full: The animation occurs from the initial state to the maximum deformed state, and then back through to the initial state. The cycle then repeats.
- Oscillate: The animation occurs from the initial state to the maximum deformed state, and then back through to the initial start, to the negative of the maximum state, and then back to the initial state. The cycle then repeats.
Probe
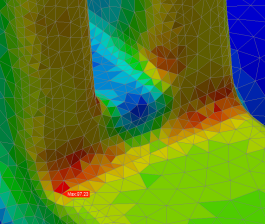
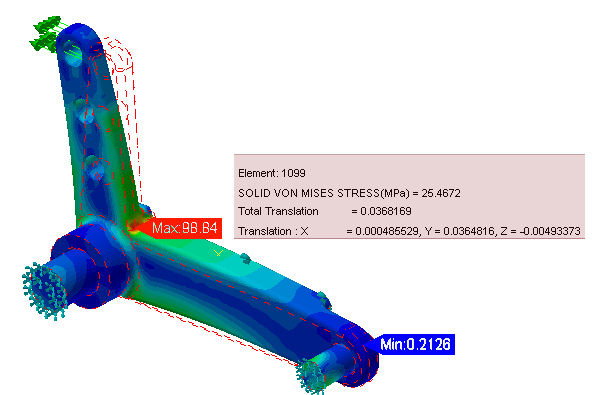
To view the exact value of a quantity on the model, click Probes from the Results panel of the ribbon. While the Probe tool is active, an information box displays the active scalar value where the cursor contacts the model:
The Plot Templates topic in the User's Guide contains additional information about visualizing results.
|
Previous Topic: Analysis Settings |
Next Topic: Compare the Iterations Exercise |