
Use the Comparison Analysis page of the Options dialog to specify the setting of the error data produced by comparison analysis:
- Click File > Options > Application Options > Tools > Analysis > Comparison Analysis.
- Use the following options to specify the comparison analysis settings:
Error Display:
- Display legend — Select this option to show or hide the error legend in the graphics window.
- Always display errors — Select this option to automatically show or hide deviations after they have been calculated.
- Display error under cursor — Select this option to show or hide the numerical deviation beneath the cursor when you hover your cursor over the comparison.
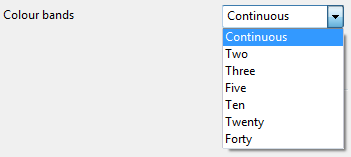
- Colour bands — Select an option from the list to change how the deviations are displayed on the model:
- Continuous — The deviations are displayed using a continuous scale.
- Two — The deviations are displayed using two distinct colours.
- Three — The deviations are displayed using three distinct colours.
- Five — The deviations are displayed using five distinct colours.
- Ten — The deviations are displayed using ten distinct colours.
- Twenty — The deviations are displayed using twenty distinct colours.
- Forty — The deviations are displayed using forty distinct colours.
Note: Colour bands is not available if Display errors to tolerance is selected. - Width of error lines — Enter a value to define the width of the error bands shown on the model when curve deviations are displayed.
Error Range:
- Display errors to tolerance — Select this option to display the deviations in two or three colour bands. The bands are set according to the general tolerance.
This option is deselected by default.
If Display errors to tolerance is deselected, select the required number of Colour bands from the list:
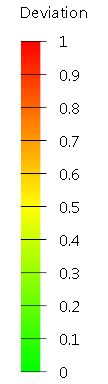
- Display absolute range — Select this option to display the absolute (modulus) values of deviation. That is the range of errors from
0 to the maximum value.
- Set error range automatically — Select this option to automatically set the error range. When this option is selected, the range is set each time you perform a comparison.
- Range type — Select the required range type from the drop-down list:
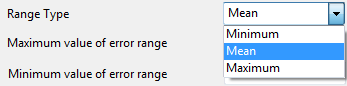
Choose from:
- Minimum — to set the colours so the minimum value of the scale is shown in green.
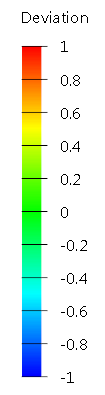
- Mean — to set the colours so the mean value of the scale is shown in green.
- Maximum — to set the colours so the maximum value of the scale is shown in green.
- Maximum value of error range — Enter a value into the field to define the maximum value of the error range. In the following example:
- Maximum value of error range is set 1.
- Colour bands
are
Continuous.
- Minimum value of error range — Enter a value into the field to define the minimum value of the error range.
- Sample Point Density — Use the slider to control the number density of points used to calculate differences between your models. A larger Sample Point Density produces more accurate results, with a longer computation time. A smaller Sample Point Density produces less accurate results, with a shorter computation time.