Decision Center: Compare Thermal Comfort
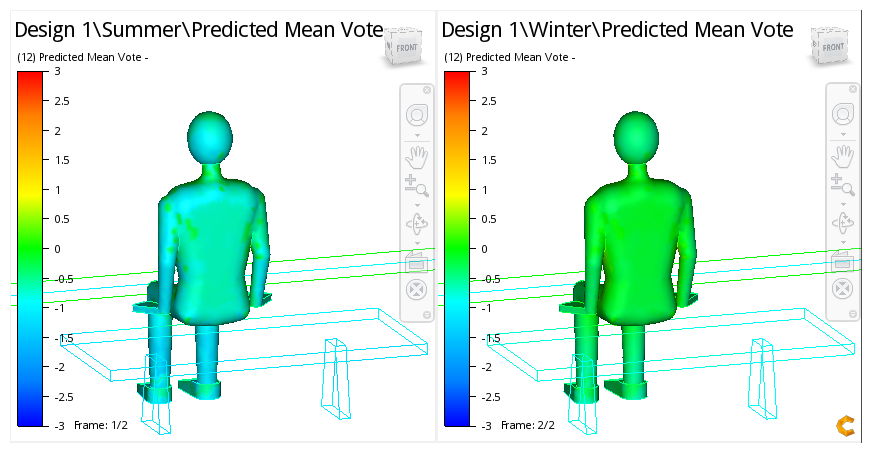
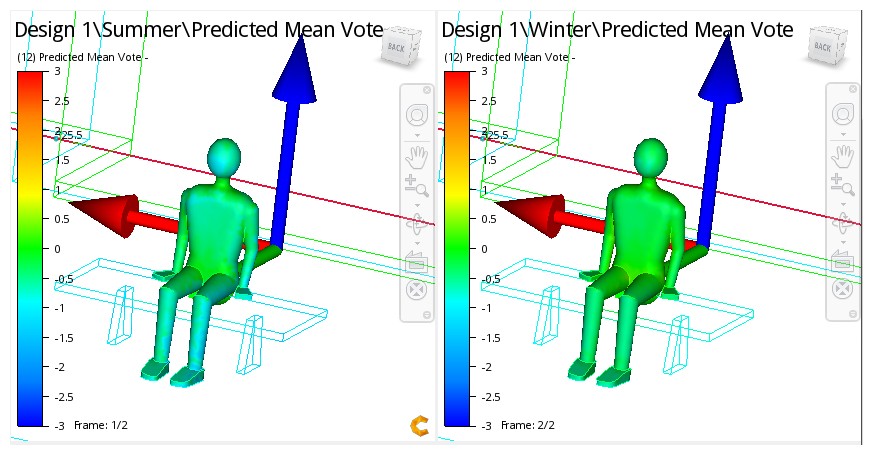
In an earlier step, we looked at the Predicted Mean Vote (PMV), a measure of the level of comfort of an occupant in his surroundings. In this step, we'll compare the level of thermal comfort in the summer and winter scenarios. This will help us to assess if the ventilation strategy in the hall is effectively keeping the occupant comfortable for both summer and winter design days.
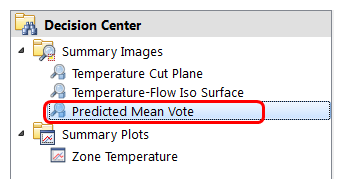
1. In the Decision Center, click Predicted Mean Vote.
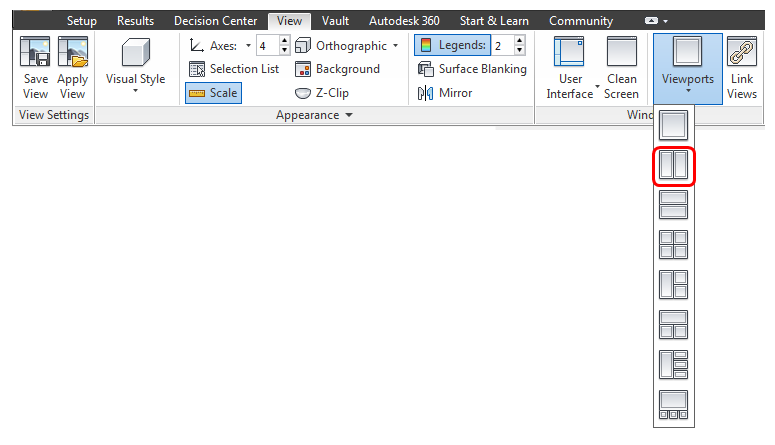
2. Split the view into two viewports. Do this by clicking View (tab) > Window (panel) > Viewports. Select the vertical split row option:
3. The default legend range automatically extends across the range of PMV values found in the scenarios of the design study. To add clarity to the Summary Image, change the range to encompass the entire PMV scale:
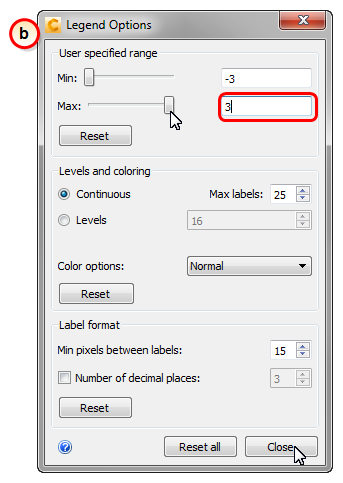
- a. Right click on the legend from either view, and click Options...
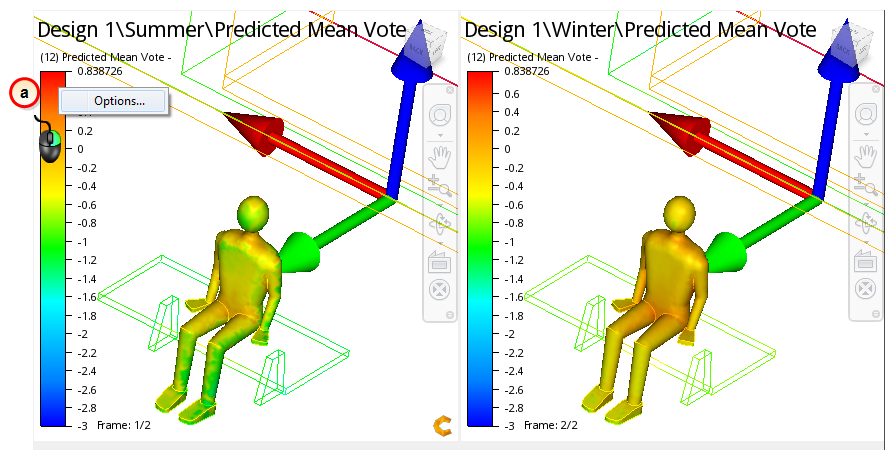
- b. Slide the Max slider to 3. (You may have to key in 3 if the Max slider range is less than 3.) Click Close.
4. Zoom in and compare the PMV on the front of the occupant.
8. Rotate the model to view the PMV of the occupant's back.