Results: Flow and Temperature Distribution with an Iso Surface
In this step, we'll use an iso surface to view the flow and temperature. Iso surfaces are really useful, and show all the areas in the model where the selected result quantity (air velocity, temperature, etc.) is the same value. They can be even be colored by a different quantity to provide great insight into the relationship between two quantities such as air velocity and temperature.
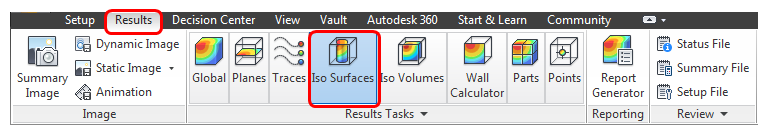
1. Click Iso Surfaces on the Results tab:
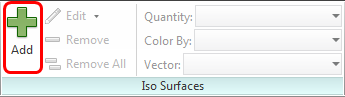
2. To create an Iso Surface, click Add on the Iso Surfaces context panel:
3. Click Edit from the Iso Surfaces context panel.
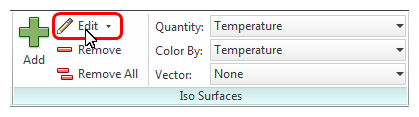
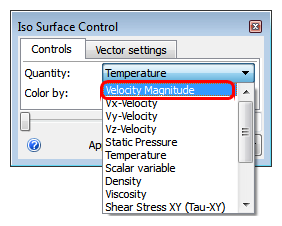
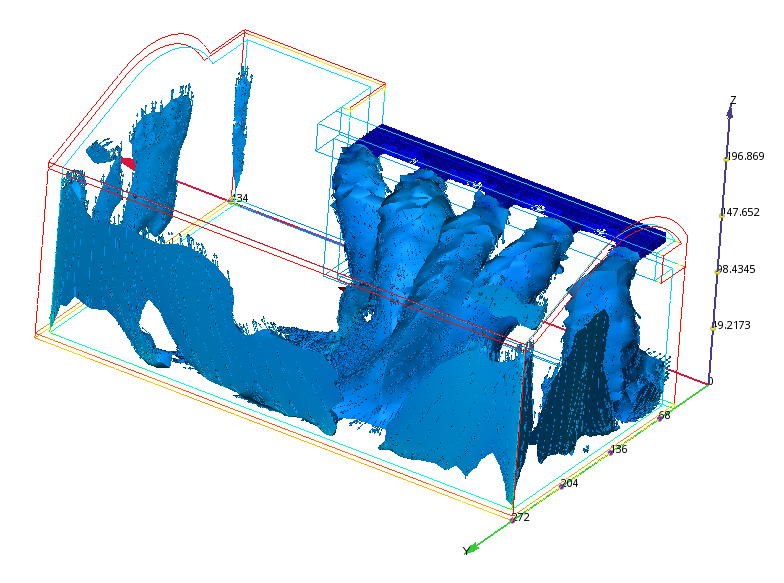
4. To show the iso surface at a constant velocity value, change the Quantity to Velocity Magnitude.
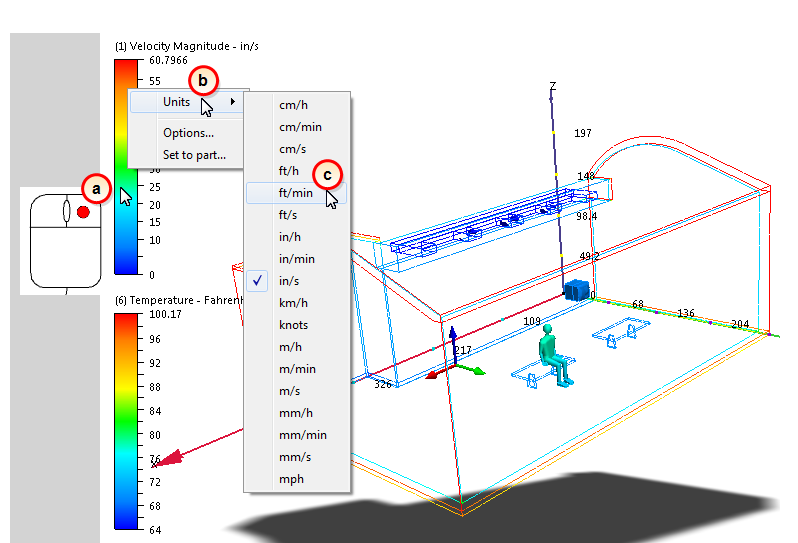
5. The default units of velocity magnitude are in/s. Let's change them to ft/min...
- a. Right click directly on the Velocity Magnitude legend (as shown below).
- b. Click Units.
- c. Select ft/min from the menu.
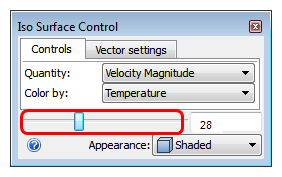
6. On the Iso Surface Control dialog box, change the value to 28. (Use the slider or simply key in "28" and click Enter on your keyboard.)
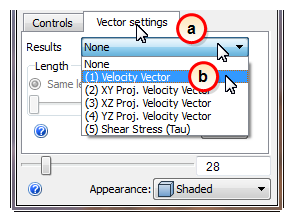
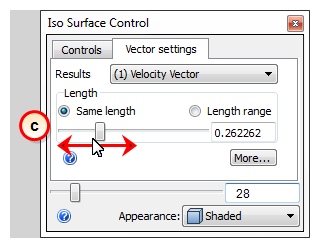
7. Display vectors on the iso surface:
- a. Click the Vector settings tab.
- b. Select Velocity Vector from the Results menu.
- c. You may need to adjust the vector length to see them better. Make them bigger by dragging the Length slider to the right; smaller by dragging to the left:
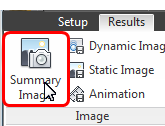
8. To save a Summary Image, click Summary Image from the Results tab.
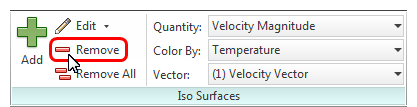
9. Because the summary image is saved, we can delete the iso surface. Click the Remove on the Iso Surfaces context panel.