This topic introduces the 1D model in the sample database and guides you through key workflows for reviewing, designing, simulating, and analysing a drainage network.
You will learn how model data is structured, how supporting objects are used to configure simulations and design, and how to interpret results.
Open and explore the model
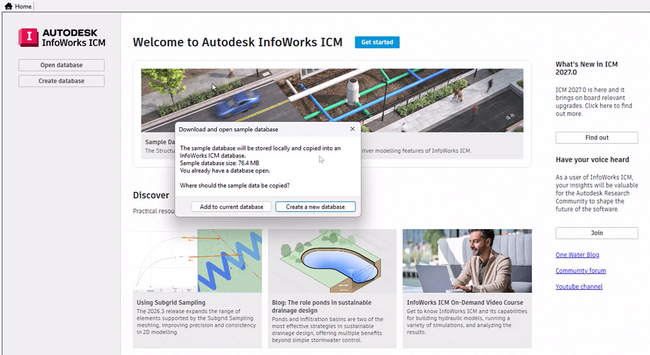
Open the 1D network from the Model Group in the Explorer Window to display it in the GeoPlan.
The model includes:
- pipes (links)
- nodes (for example manholes, outfalls, storage)
- catchments and inflows
- predefined objects for design and simulation workflows
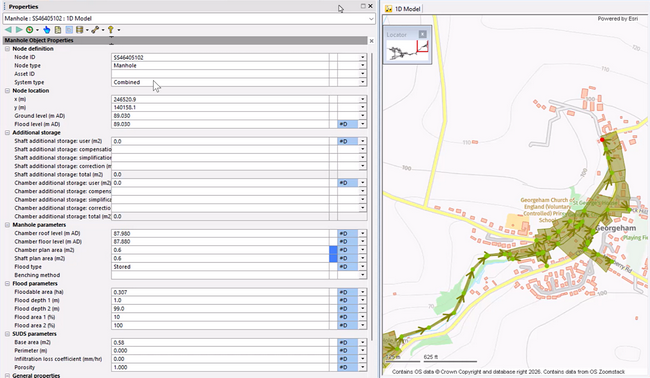
Select any object in the GeoPlan to view its properties. Use the Object properties window to inspect full datasets for the selected object. Nodes define key attributes such as levels, storage, and connectivity within the network.
Understanding how the model is structured and how object properties are organised allows you to confidently navigate and inspect network data before applying design or simulation workflows.
Use model objects to configure the network
The sample model includes predefined objects that control validation, inputs, and outputs.
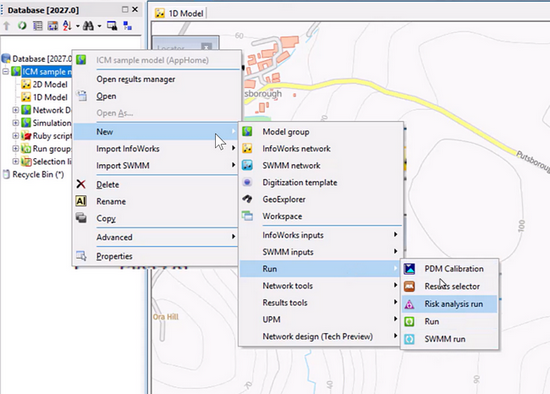
See Model group context menu for an overview of the features available through the menus visible on the image below.
Engineering validation
Use validation to check the network against defined rules.
- Access: Explorer → right-click → New → Engineering validation
- Use to identify objects that do not meet specified criteria
- Results highlight affected elements without preventing simulation
Validation highlights issues but does not prevent simulation, allowing you to review and correct problems without interrupting your workflow.
This helps you identify data inconsistencies early and ensures the network meets required design rules before running simulations or applying automated design.
See Validating networks.
Inflow and level data
Use inflow or level data to represent upstream conditions without modelling the full system.
- Access: Explorer → New → Inflow data / Level data
- Assign to nodes to introduce flow or level time series
This allows you to represent upstream conditions without modelling the full contributing system, reducing model complexity while preserving realistic hydraulic behaviour.
Rainfall events
Use rainfall events to drive storm simulations.
- Access: Explorer → New → Rainfall event
- Select or define return periods and durations
Rainfall events define the driving input for storm simulations and determine how the network responds under different return periods and durations.
See Rainfall events.
Wastewater profiles
Use wastewater profiles to simulate sanitary flow.
- Access: Explorer → New → Wastewater profile
- Define flow patterns based on population or land use
This enables you to represent realistic flow patterns over time, reflecting how demand varies throughout the day based on population and land use.
Result selection
Control which outputs are generated during simulation.
- Access: Explorer → New → Result selector
- Limit results to selected parameters or objects to reduce output size
This helps optimise simulation performance and storage by focusing only on the outputs that are relevant to your analysis.
See Results.
Generate and review long sections
Long sections provide a profile view of the network along a selected path.
They are particularly useful for reviewing network connectivity and assessing design changes before and after applying Network design.
- Access: GeoPlan → Long section tools
- Use downstream tracing to define a path
- Review levels, gradients, and connectivity
This provides a clear engineering view of network behaviour along a flow path, making it easier to identify connectivity issues, slope inconsistencies, and the impact of design changes.
See Long section window.
You can also automate long section generation using Ruby script.
- Access: Explorer → Ruby scripts
- Run by dragging the script onto the network or using the script editor
Scripts can be used to generate multiple upstream-to-downstream paths and store them as selection lists.
Work with scenarios
Scenarios allow you to compare alternative network configurations.
- Access: Explorer → Scenarios → New scenario
- Create scenarios that inherit from a base configuration
- Switch between scenarios to compare results
Use scenarios to test design changes, alternative inputs, or different modelling assumptions.
This allows you to test alternative designs or assumptions without modifying the base model, making it easier to compare outcomes and evaluate different approaches.
Apply Network design
Network design can be used to size pipes based on defined Design constraints and rainfall inputs.
Network design is a key workflow in this sample and allows you to automatically size pipes based on defined Design constraints available pipes (see Pipe network catalog) and rainfall inputs (see IDF curve).
- Access: GeoPlan → select network → Network design
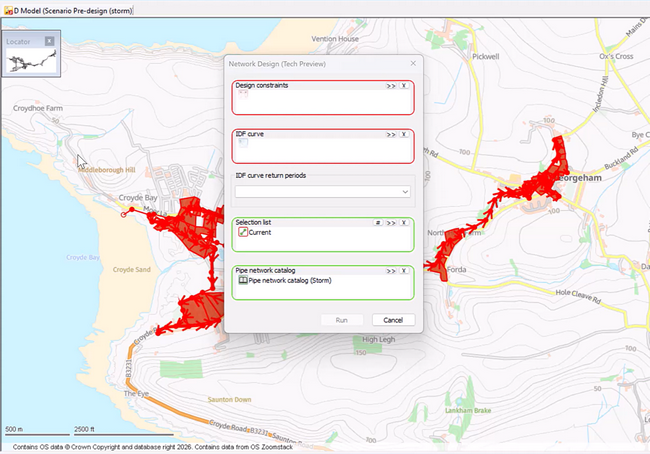
The design workflow uses supporting objects:
- Pipe network catalog - defines available sizes and constraints
- Design constraints - defines allowable slope, velocity, depth, etc.
- IDF curve - provides rainfall intensity data
- Selection list - limits the design area
You can:
- adjust penalty weighting to influence design outcomes, for example prioritising smaller pipe sizes or shallower gradients.
- choose whether flows are derived from rainfall or specified directly
- define how connections and levels are handled
- include or exclude specific design constraints
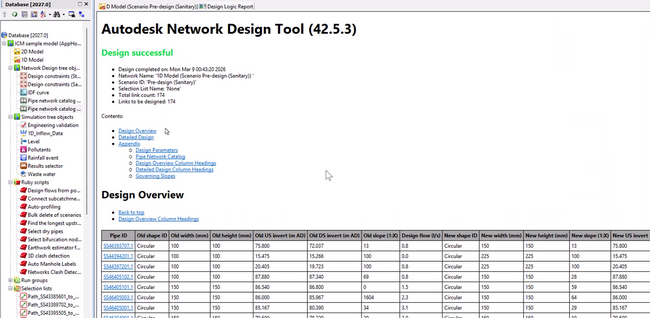
The Design report explains how each design decision was made, including governing constraints such as flow, velocity, depth, or connectivity.
This enables you to automatically generate hydraulically consistent designs and understand how design decisions are made through the Design report, helping you optimise networks based on engineering priorities.
Run a simulation
Simulations calculate how the network responds over time to rainfall, inflows, and other inputs.
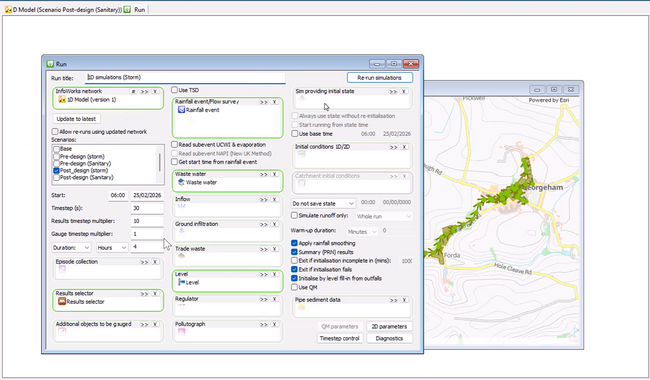
- Access: Explorer → Run Group → drag inputs into a Run
To run a simulation:
- Create or open a Run.
- Drag required inputs (rainfall, inflows, profiles) into the run.
- Select the scenario to use.
- Start the Simulation.
Simulation parameters control how calculations are performed. Default values are configured for typical accuracy and do not normally require adjustment .
This allows you to evaluate how the network performs under defined conditions and assess whether it meets design and operational requirements.
Review simulation outputs
Check the log
- Access: open simulation → Log results
- Review messages for errors or warnings
- Confirm simulation completed successfully
Logs provide a record of simulation activity and highlight issues affecting reliability.
This enables you to diagnose issues, understand system behaviour over time, and identify areas of concern such as surcharge, flooding, or capacity limitations.
Replay results in the GeoPlan
- Drag the simulation onto the GeoPlan
- Use replay controls to step through time
This allows you to observe how the network behaves during the simulation.
Inspect object results
- Select a node or link
- View results in the Object properties window
- Navigate through the timeline
Use themes and visualisation
- Apply themes to display depth, flow, or flooding
- Identify areas of surcharge or high flow
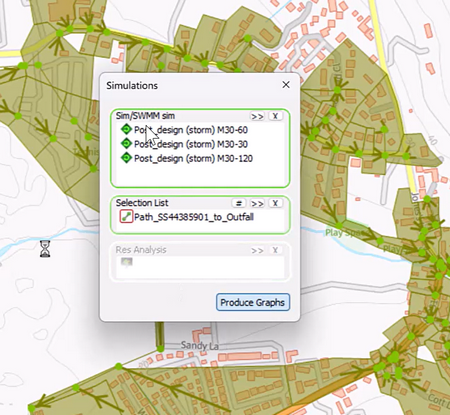
Use graphs and grids
- Access: Results toolbar → Graph / Grid tools
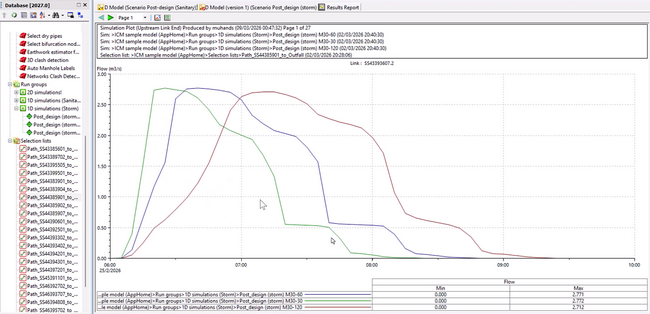
- Plot time-varying results such as flow and depth
- Review tabular data for detailed analysis
See Graphing.
Results include both time-varying values and summary values such as maximum depth and flow.
You can also use grid reports and result post-processing tools to compare outputs across multiple simulations and identify trends or worst-case conditions.
What you can learn from this model
This model helps you learn how to:
- structure and inspect a drainage network
- configure inputs such as rainfall and inflows
- apply automated design to size network elements
- run simulations and validate results
- analyse performance using visual and analytical tools
- compare alternative configurations using scenarios
Next steps
You can extend this workflow by:
- modifying network data and rerunning simulations
- applying alternative design criteria
- comparing multiple scenarios
- integrating the 1D model with a 2D surface model
Proceed to 2D Sample Model: Workflows and capabilities to make the most out of the sample database.