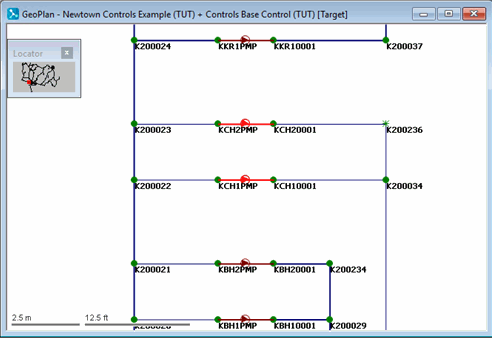
The network contains a pair of pumping stations (KCH1PMP and KCH2PMP) which pump to the transfer node and reservoir in the south. KCH2PMP is the duty pump and is initially switched off; KCH1PMP is the standby pump (and therefore permanently off). The properties of these pumps will be changed, so that KCH1PMP is the duty pump and is initially on, while KCH2PMP is the standby pump. The operating range for the duty pump will be widened.
To change the pump properties:
- Open the 'Newtown Controls Example' network icon.
- Open the Controls Base Control and associate it with the network to edit it.
- Zoom in on KCH1PMP.KCH10001.1 and KCH2PMP.KCH20001.1.
- Display the properties for the pumps:
- In the Control Parameters section, the
Mode of Control is shown as AUTO in each case. In this mode, pump status is set according to the level recorded at a node (in this case, the reservoir, CRES2).
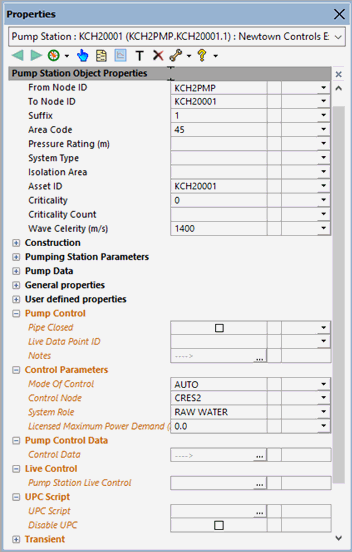
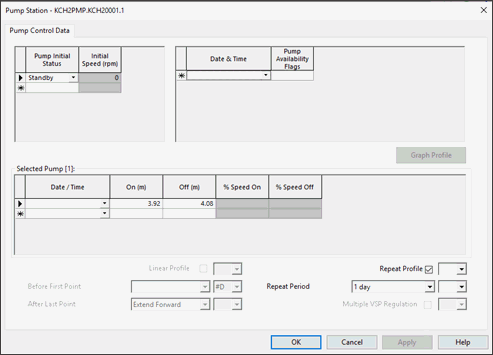
- The Pump Control Data section shows the initial status of the pump. For KCH2PMP, the
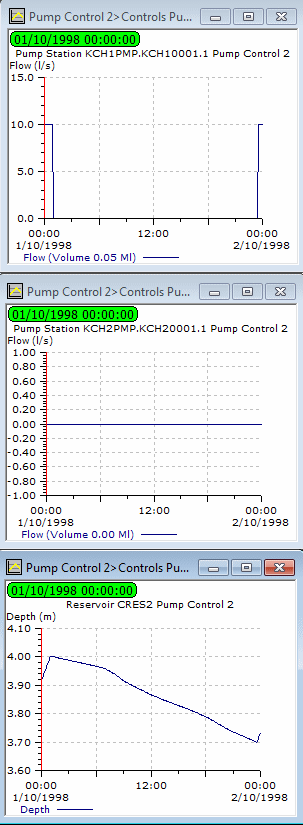
Pump Initial Status is shown as 'Standby', indicating that the pump is available but initially switched off; the reservoir levels at which the pump is switched on and off are given as 3.92 m and 4.08 m. For KCH1PMP, the status is 'Not Available'.
- In the Control Parameters section, the
Mode of Control is shown as AUTO in each case. In this mode, pump status is set according to the level recorded at a node (in this case, the reservoir, CRES2).
- Change the properties in the Pump Control Data section so that KCH1PMP is the duty pump and initially on, and KCH2PMP is the standby pump (that is, not available):
- For KCH2PMP, change the Pump Initial Status to 'Not Available'.
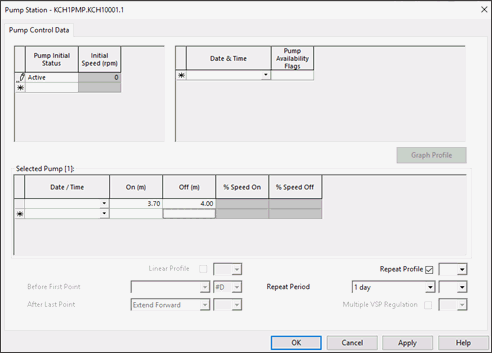
- For KCH1PMP, change the
Pump Initial Status to 'Active'; change the
On value to 3.70 m and
Off to 4.00 m. This widens the operating range for the pump.
- Commit the control data leaving a comment 'Controls Pump Example 1'. Close the GeoPlan.
- Run a simulation:
- Open the 'Pump Control' run from the Newtown Control Simulations group.
- In the Run Title box, change the title to 'Pump Control 2'.
- Drag the 'Controls Pump Example 2' item into the Control box.
- Click Run Simulations.
- When the simulation is complete, click the
 (Close dialog) button.
- View the simulation results:
- Open the simulation from the 'Pump Control 2' run.
- Use the
 (Graph) button to display graphs of flow out of the pumping stations and a graph of depth for the reservoir.
- Minimise the GeoPlan.
- Tile the views horizontally.
Originally, both pumps were off and the reservoir level dropped until the depth was 3.92 m. Now, the views show that KCH1PMP is on initially, turning off when the reservoir level reaches 4.00 m and back on again when it drops to 3.70 m. KCH1PMP is permanently off.
- Close all views.
The next stage demonstrates the effect of changing the flow profile at a transfer node.
 Back to flowchart