The example network will be used to demonstrate the application of controls.
Valves can be added to a network for a number of purposes: for example, to control flow or regulate pressure. In this case, valves will be used to close a pipe temporarily and to regulate the pressure in one part of the network. The aim of these valves is to provide a pressure management scheme for a village in the north east of the sample network.
- Choose Open model group from the File menu. In the list of objects click to the left of 'Tutorial', click 'Control Examples' and then OK.
- Open the provided network:
- In the 'Control Examples' model group, right-click the 'Newtown Controls Example' network and select Open.
- This could also be branched via the commit history.
- Open the control data:
- In the 'Control Examples' model group, right-click the Controls Base Control data item and select Open.
- Like the network, this could also be branched via the commit history.
- The control data is
associated with the network and can be edited.
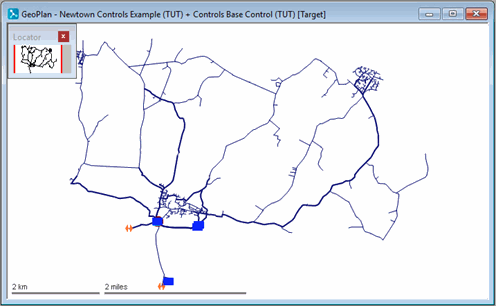
- Currently, the village under consideration is supplied by three pipes. In order to regulate pressure within the village, two of the pipes must be closed off so that the supply is through a single pipe:
- Identify link K400342.K400353.1.
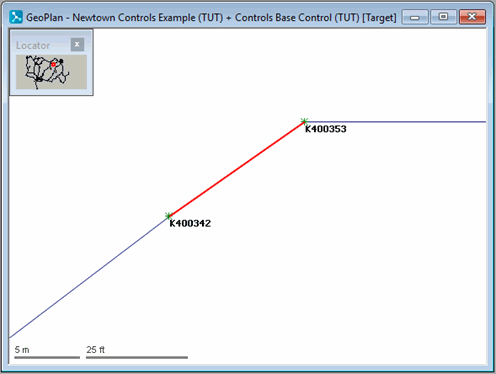
- Select the
 (Properties) tool and click the link.
- In the Properties dialog, click
Change Type, select
Valve and click
OK.
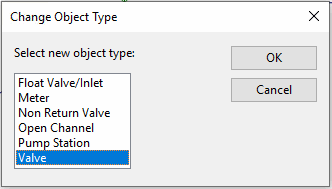
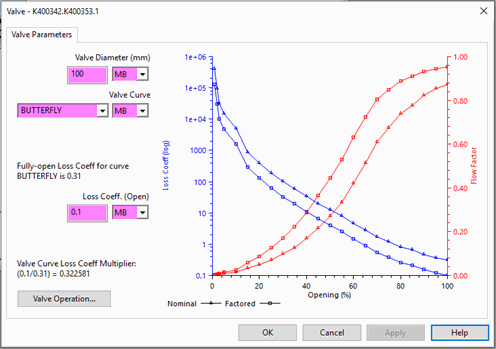
- In the Valve Parameters section of the properties sheet, set the loss coefficient to 0.1.

- Also in the Valve Parameters section, change the
Valve Diameter to 100 mm and the
Valve Curve to BUTTERFLY. View the Valve graph to see how it operates.
- In the Valve Control section, set the Mode ID to THV and the Opening (%) value to 0. This closes the valve and therefore the pipe.

- Change K400205.K400234.1 to a closed valve in the same way.
- Identify link K400342.K400353.1.
- A valve must be added in link K400276.K400133.1 to regulate flow into the village. First, two nodes must be inserted in the link:
- Zoom in on K400276.K400133.1.
- Select the
 (New Node) tool. Click the pipe.
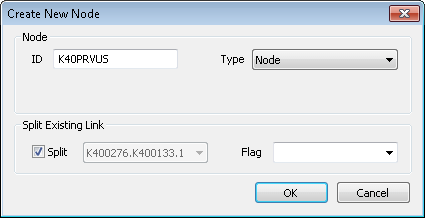
- Give the new node an ID of K40PRVUS. Click the
Split box and click
OK.
- Set the node elevation to 100.5 m in the node property sheet.
- Close the Node properties dialog by clicking OK.
- Insert a second node in the link (to the south east of the first node) in the same way, naming it K40PRVDS and setting its elevation to 100.5 m.
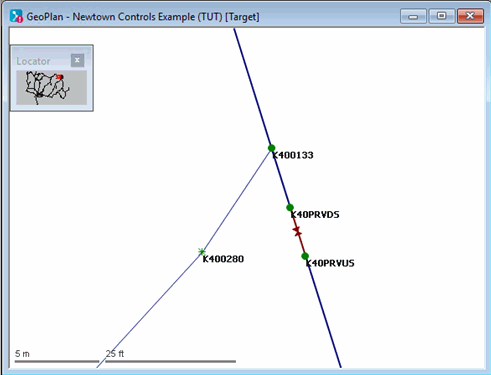
- Add the control valve:
- Select the
 (Properties) tool and click the new connecting link (K40PRVDS.K40PRVUS.1).
- In the Properties dialog, click Change Type, select Valve and click OK.
- On the properties sheet, set the Local Loss Coefficient to 0.1.
- In the Valve Parameters section, change the
Valve Diameter to 100 mm and the
Valve Curve to NEEDLE.
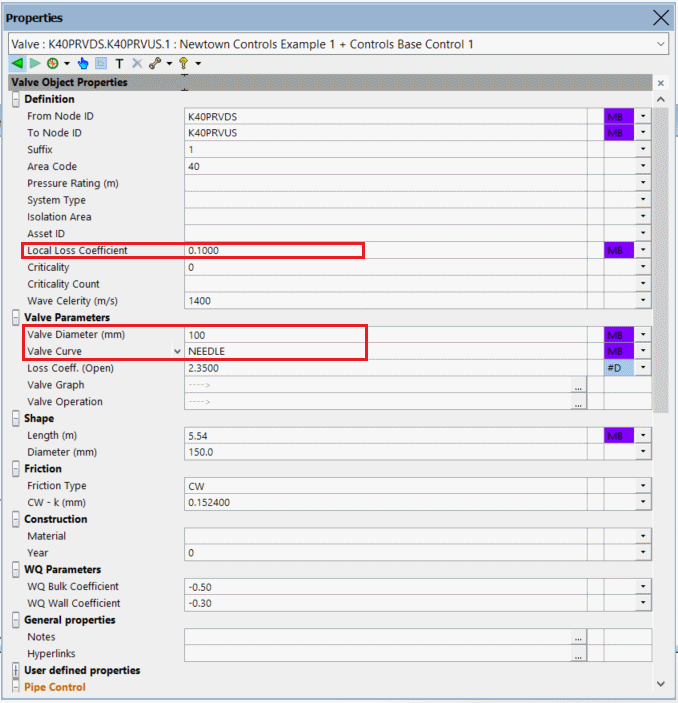
- In the Valve Control section, set the Mode ID to PRV and the Pressure to 25 m. Select K400097 as the Control Node.

- The control node is at the far end of the village. The new valve monitors the pressure at the control node and opens or closes in order to keep the pressure at a constant 25 m.
- Select the
- Commit the network and the control data (including validation, which produces some warning messages). Leave a comment 'Pressure Management Example'. Close the GeoPlan view.
- Run a simulation:
- Right-click the 'Control Examples' model group and select New | Run group. Give the run group a name of 'Newtown Control Simulations'.
- Right-click the Newtown Control Simulations group and select New | Run. The Schedule Hydraulic Run dialog is displayed. In the Run Title box, enter the title as 'Pressure Management Scheme'.
- Drag Newtown Controlled Network into the Network box.
- Drag the Newtown Modified Control Data item into the Control box.
- Drag the Profiles demand diagram into the Demand Diagram box.
- Change the Start date & time to 1 October 1998 00:00 and the End date & time to 2 October 1998 00:00.
- Change the Computational Accuracy to 0.5 l/s.
- Click Run Simulations.
- View the simulation results:
- Open the simulation from the 'Pressure Management Scheme' run.
- Use the
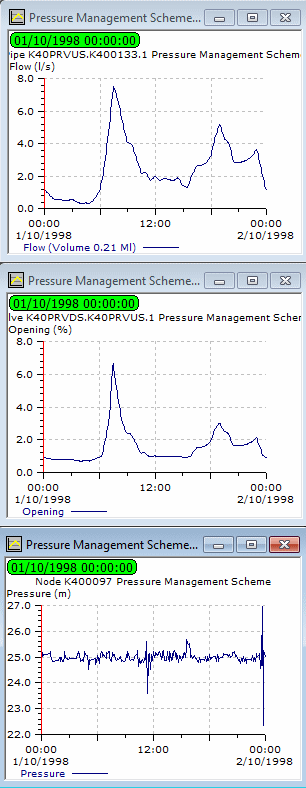
 button to display suitable graphs. For node K400097, select Pressure; for valve K40PRVDS.K40PRVUS.1, select Opening %; for pipe K40PRVUS.K400133.1, select Flow.
- Minimise the GeoPlan and tile the views horizontally.
The views show that as the pressure changes at the control node, the valve is opened or closed to maintain the control pressure. After a while, the pressure settles into a stable pattern.
- Close all views.
The next stage shows how pump controls can be modified.


