
Scaling
Deflection plots are often scaled to aid in the interpretation of the result.
Scaling deflection results is common. By scaling deflection results, you can focus on just the area of the part that is of interest. Depending on the situation, you may need to use the Examine tool to estimate the minimum and maximum values then set the scale. You may also need to set the scale several times before you get the exact range you need.
In the following figure, part (A) is not scaled. The area of interest is the bevel as indicated by the arrow. Part (B) is scaled to the values from the bevel. Areas in red are above the maximum on the bevel and blue areas are below the minimum value.
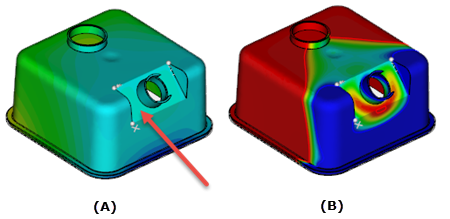
A = Z-Deflection not scaled for the bevel
B = Z-Deflection scaled to the values on the bevel